Often in a loadrunner script, many transactions are of a common type, like "save" or "search" or "report_view". These common operations need to be aggregated for reporting purposes. You want to easily create a chart showing, for example "Search Response Time" or "Searches Per Second" or "Search Response Time (percentile)".
One easy way to do this is to run the following perl script which will take any transaction and wrap it in a second "sub-transaction" of the name input. For example, suppose you have the following in your Action.c:
lr_start_transaction("Search1");
...
lr_end_transaction("Search1", LR_AUTO);
...
...
lr_start_transaction("Search2");
...
lr_end_transaction("Search2", LR_AUTO);
Following running the script in the directory with your Action.c file, passing the parameter "search" ("perl lr-subtrans.pl search"), you would now have:
lr_start_transaction("Search1");
lr_start_transaction("search");
...
lr_end_transaction("search", LR_AUTO);
lr_end_transaction("Search1", LR_AUTO);
...
...
lr_start_transaction("Search2");
lr_start_transaction("search");
...
lr_end_transaction("search", LR_AUTO);
lr_end_transaction("Search2", LR_AUTO);
This would then allow very easy reporting of the aggregate search transaction. After running the script, you have to go in and remove the sub-transactions around transactions that are not relevant, like perhaps "login", "homepage", "back", etc.
Script
# lr-subtrans.pl
# Loadrunner add subtransaction script
#
#
use File::Copy;
$transname = $ARGV[0];
$actionfile = "Action.c";
$backupfile = "Action.c.bak";
$outfile = "Action.c.subtrans.txt";
if ($transname eq "-?" or $transname eq "/?" or $transname eq "-help" or $transname eq "/help" or $transname eq "")
{
die "USAGE: perl lr-subtrans.pl <transactionName> (Note: each transaction will be wrapped with a transaction named <transactionName>)\n";
}
copy($actionfile, $backupfile) or die "File cannot be copied.";
open (INFILE, $actionfile) or die "Can't open $actionfile";
open (OUTFILE, ">$outfile") or die "can't open $outfile";
while ($line = <INFILE>)
{
# Add server parameter and default check
if ($line =~ "lr_start_transaction")
{
print OUTFILE $line;
print OUTFILE "\tlr_start_transaction(\"$transname\"); \n";
}
# BIIT ID ("SESSION ID") RULE
elsif ($line =~ "lr_end_transaction")
{
print OUTFILE "\tlr_end_transaction(\"$transname\", LR_AUTO); \n";
print OUTFILE $line;
}
else
{
print OUTFILE $line;
}
}
close (INFILE);
close (OUTFILE);
# Copy Action.c.correlated.txt to Action.c
copy($outfile, $actionfile) or die "Copy failed: $!";
Thursday, July 5, 2012


Monday, June 4, 2012
Reporting Response Times - Percentile Distributions and Trends
Response time metrics can be very misleading. An average of 2 seconds can mask occasional very high values that could be relevant to performance goals. It can also mask cyclical trends. The same is true of reporting median or specific percentiles such as 95th percentile. An informative response time report should include two elements:

- Response time percentile distribution
- Response time trends with enough granularity to see spikes and patterns
Here is an example of these two elements:
Response Time Percentile Distribution
The distribution chart shows clearly what percentage of response times might be above the response time goal.

Response Time Trend
The trend chart shows clearly an upward trend over time, an important property that would be lost in any single response time metric. It also includes enough granularity to show the distribution pattern of response time spikes.

Thursday, May 24, 2012
Jstat Java Heap and Garbage Collection Analysis
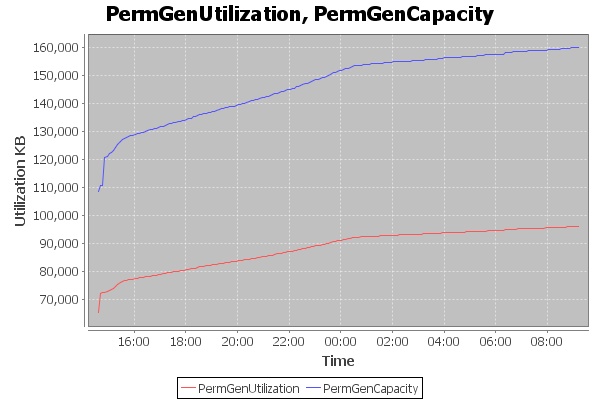
Java memory utilization and garbage collection activity can be analyzed fairly nicely with a set of seven charts showing utilization and capacity of the different generations, and garbage collection activity in the generations:
The following is an example of these seven charts:
Garbage collections in the old generation, number of collections per interval and time spent in collections per interval:


Jstat is a tool that comes with the Java JDK that can be used to monitor the java heap, including information on the generations, the number of garbage collections and the time taken by garbage collections. With its output the above seven charts can be created.
Jstat can be collected as follows for a given java process pid:
jstat -gc 2862 60000
In this case information is output every 60 seconds for java process 2862:
S0C S1C S0U S1U EC EU OC OU PC PU YGC YGCT FGC FGCT GCT
104832.0 104832.0 26921.8 0.0 838912.0 224806.4 9437184.0 797674.3 85568.0 85341.5 112 3.127 0 0.000 3.127
104832.0 104832.0 0.0 52798.7 838912.0 828526.5 9437184.0 843524.4 86144.0 86031.4 122 3.402 0 0.000 3.402
,104832.0 104832.0 0.0 26349.2 838912.0 282471.0 9437184.0 902120.4 86336.0 86084.9 133 3.759 0 0.000 3.759
The columns that are output can be interpreted as follows:
It is convenient to have a script that determines the java pid rather than having to enter it manually. A script such as the following can do that:
ps -ef|grep java|grep -v grep|awk '{print "jstat -gc "$2" 10000}'
This will find the java process running and generate a jstat command on that process id. If the system may have multiple java processes, additional filters are needed to isolate a single pid.
It is also convenient to prepend a timestamp to jstat rows. While there is a jstat flag to output milliseconds since java startup, a human-readable timestamp is more useful for later correlation to other system events. This can be done using the following timestamp.sh perl script:
#!/usr/bin/perl
#while (<>) { print localtime() . ": $_"; }
while (<>)
{
($sec,$min,$hour,$mday,$mon,$year,$wday,$yday,$isdst) = localtime(time);
$secpad = sprintf( "%02d", $sec );
$minpad = sprintf( "%02d", $min );
$hourpad = sprintf( "%02d", $hour );
$monpad = sprintf( "%02d", $mon );
$mdaypad = sprintf( "%02d", $mday );
$yearpad = sprintf( "%02d", ($year + 1900) % 100 );
$time = "$monpad\/$mdaypad\/$yearpad $hourpad:$minpad:$secpad";
print $time . ",$_";
#17/04/112 16:40:14
}
The timestamp.sh script can be integrated into the jstat output as follows:
jstat -gc 2862 10000 | timestamp.sh
This can be combined with java pid filter and run in the background outputting to a log file as follows:
ps -ef|grep java|grep -v grep|awk '{print "jstat -gc "$2" 10000 | ./timestamp.sh > jstat.log"}' | sh &
The result is data such as the following:
04/22/12 15:07:49, S0C S1C S0U S1U EC EU OC OU PC PU YGC YGCT FGC FGCT GCT
04/22/12 15:07:49,104832.0 104832.0 26921.8 0.0 838912.0 224806.4 9437184.0 797674.3 85568.0 85341.5 112 3.127 0 0.000 3.127
04/22/12 15:08:49,104832.0 104832.0 0.0 52798.7 838912.0 828526.5 9437184.0 843524.4 86144.0 86031.4 122 3.402 0 0.000 3.402
04/22/12 15:09:49,104832.0 104832.0 0.0 26349.2 838912.0 282471.0 9437184.0 902120.4 86336.0 86084.9 133 3.759 0 0.000 3.759
04/22/12 15:10:49,104832.0 104832.0 48749.7 0.0 838912.0 544053.8 9437184.0 954768.5 86336.0 86092.8 144 4.083 0 0.000 4.083
04/22/12
# Read in jstat log file
# Calculate the difference from previous lines for full and young gen GCs, both count and time
# YGC Number of young generation GC Events.
# YGCT Young generation garbage collection time.
# FGC Number of full GC events.
# FGCT Full garbage collection time.
#
# 04/21/12 16:15:26, S0C S1C S0U S1U EC EU OC OU PC PU YGC YGCT FGC FGCT GCT
# 04/21/12 16:15:26,3328.0 3328.0 0.0 3248.5 1302784.0 732415.6 5863232.0 4035920.6 21248.0 8874.5 195 38.069 6 70.234 108.303
#
# Output the result to jstat-parsed.log
$infile = $ARGV[0];
$outfile = "jstat-parsed.csv";
open (INFILE, "<$infile") or die "can't open input file $infile";
open (OUTFILE, ">$outfile") or die "can't open output file $outfile";
print OUTFILE "Time,GCYoungGenCount,GCYoungGenTime,GCOldGenCount,GCOldGenTime,OldGenCapacity,OldGenUtilization\n";
print "Time,YGCount,YGTime,FGCount,FGTime\n";
#read header
<INFILE>;
#prime variables on first line of input
$line = <INFILE>;
@cells = split(/\s+/, $line);
$YGC = $cells[11];
$YGCT = $cells[12];
$FGC = $cells[13];
$FGCT = $cells[14];
#print "PRIME:timestamphere,$YGC,$YGCT,$FGC,$FGCT\n";
# now read in each line, calculating the diff from previous line and outputting values
while ($line = <INFILE>) {
#$line = <INFILE>;
# get new row's values
@cells = split(/\s+/, $line);
$time = $cells[0] . " " . $cells[1];
$time =~ s/,.*//g;
$nYGC = $cells[11];
$nYGCT = $cells[12];
$nFGC = $cells[13];
$nFGCT = $cells[14];
$OGCapacity = $cells[7];
$OG = $cells[8];
#print "NEW:$time,$nYGC,$nYGCT,$nFGC,$nFGCT\n";
# calculate differences from previous row's values
$diffYGC = $nYGC - $YGC;
$diffYGCT = $nYGCT - $YGCT;
$diffFGC = $nFGC - $FGC;
$diffFGCT = $nFGCT - $FGCT;
print OUTFILE "$time,$diffYGC,$diffYGCT,$diffFGC,$diffFGCT,$OGCapacity,$OG\n";
print "$time,$diffYGC,$diffYGCT,$diffFGC,$diffFGCT,$OGCapacity,$OG\n";
# now reset variables to current line's values
$YGC = $nYGC;
$YGCT = $nYGCT;
$FGC = $nFGC;
$FGCT = $nFGCT;
}
close (OUTFILE);
close (INFILE);
This perl script will give output such as the following:
Time,GCYoungGenCount,GCYoungGenTime,GCOldGenCount,GCOldGenTime,OldGenCapacity,OldGenUtilization
04/21/12 15:39:13,68,3.349,2,0.0530000000000002,10754040.0,5733223.0
04/21/12 15:44:13,68,3.261,2,0.0499999999999998,10754040.0,4523825.4
04/21/12 15:49:13,69,3.41,2,0.0550000000000002,10754040.0,3766710.6
04/21/12 15:54:13,68,3.23700000000001,2,0.0509999999999999,10754040.0,3008307.3
04/21/12 15:59:13,68,3.169,2,0.052,10754040.0,2428630.4
- Garbage Collection - Old Generation (number of collections and time spent in collection)
- Garbage Collection - Young Generation (number of collections and time spent in collection)
- Utilization and Capacity - Old Generation Space
- Utilization and Capacity - Survivor Space 0
- Utilization and Capacity - Survivor Space 1
- Utilization and Capacity - Eden Space
- Utilization and Capacity - Permanent Space
The following is an example of these seven charts:
Garbage collections in the old generation, number of collections per interval and time spent in collections per interval:

Garbage collections in the young generation, number of collections per interval and time spent in collections per interval:

Old generation utilization and capacity:

Survivor space 1 utilization and capacity:

Survivor space 0 utilization and capacity:

Eden space utilization and capacity:

Permanent space utilization and capacity:
Jstat can be collected as follows for a given java process pid:
jstat -gc 2862 60000
In this case information is output every 60 seconds for java process 2862:
S0C S1C S0U S1U EC EU OC OU PC PU YGC YGCT FGC FGCT GCT
104832.0 104832.0 26921.8 0.0 838912.0 224806.4 9437184.0 797674.3 85568.0 85341.5 112 3.127 0 0.000 3.127
104832.0 104832.0 0.0 52798.7 838912.0 828526.5 9437184.0 843524.4 86144.0 86031.4 122 3.402 0 0.000 3.402
,104832.0 104832.0 0.0 26349.2 838912.0 282471.0 9437184.0 902120.4 86336.0 86084.9 133 3.759 0 0.000 3.759
The columns that are output can be interpreted as follows:
| Column | Description |
|---|---|
| S0C | Current survivor space 0 capacity (KB). |
| S1C | Current survivor space 1 capacity (KB). |
| S0U | Survivor space 0 utilization (KB). |
| S1U | Survivor space 1 utilization (KB). |
| EC | Current eden space capacity (KB). |
| EU | Eden space utilization (KB). |
| OC | Current old space capacity (KB). |
| OU | Old space utilization (KB). |
| PC | Current permanent space capacity (KB). |
| PU | Permanent space utilization (KB). |
| YGC | Number of young generation GC Events. |
| YGCT | Young generation garbage collection time. |
| FGC | Number of full GC events. |
| FGCT | Full garbage collection time. |
| GCT | Total garbage collection time. |
It is convenient to have a script that determines the java pid rather than having to enter it manually. A script such as the following can do that:
ps -ef|grep java|grep -v grep|awk '{print "jstat -gc "$2" 10000}'
This will find the java process running and generate a jstat command on that process id. If the system may have multiple java processes, additional filters are needed to isolate a single pid.
It is also convenient to prepend a timestamp to jstat rows. While there is a jstat flag to output milliseconds since java startup, a human-readable timestamp is more useful for later correlation to other system events. This can be done using the following timestamp.sh perl script:
#!/usr/bin/perl
#while (<>) { print localtime() . ": $_"; }
while (<>)
{
($sec,$min,$hour,$mday,$mon,$year,$wday,$yday,$isdst) = localtime(time);
$secpad = sprintf( "%02d", $sec );
$minpad = sprintf( "%02d", $min );
$hourpad = sprintf( "%02d", $hour );
$monpad = sprintf( "%02d", $mon );
$mdaypad = sprintf( "%02d", $mday );
$yearpad = sprintf( "%02d", ($year + 1900) % 100 );
$time = "$monpad\/$mdaypad\/$yearpad $hourpad:$minpad:$secpad";
print $time . ",$_";
#17/04/112 16:40:14
}
The timestamp.sh script can be integrated into the jstat output as follows:
jstat -gc 2862 10000 | timestamp.sh
This can be combined with java pid filter and run in the background outputting to a log file as follows:
ps -ef|grep java|grep -v grep|awk '{print "jstat -gc "$2" 10000 | ./timestamp.sh > jstat.log"}' | sh &
The result is data such as the following:
04/22/12 15:07:49, S0C S1C S0U S1U EC EU OC OU PC PU YGC YGCT FGC FGCT GCT
04/22/12 15:07:49,104832.0 104832.0 26921.8 0.0 838912.0 224806.4 9437184.0 797674.3 85568.0 85341.5 112 3.127 0 0.000 3.127
04/22/12 15:08:49,104832.0 104832.0 0.0 52798.7 838912.0 828526.5 9437184.0 843524.4 86144.0 86031.4 122 3.402 0 0.000 3.402
04/22/12 15:09:49,104832.0 104832.0 0.0 26349.2 838912.0 282471.0 9437184.0 902120.4 86336.0 86084.9 133 3.759 0 0.000 3.759
04/22/12 15:10:49,104832.0 104832.0 48749.7 0.0 838912.0 544053.8 9437184.0 954768.5 86336.0 86092.8 144 4.083 0 0.000 4.083
04/22/12
Analyze jstat log
To get the total time and number of Full GC and young generation GCs, the cumulative values output by jstat need to be diff'd versus the previous line. The jstat log can be analyzed into a simple csv file with this per-interval GC information using a perl script such as the following:# Read in jstat log file
# Calculate the difference from previous lines for full and young gen GCs, both count and time
# YGC Number of young generation GC Events.
# YGCT Young generation garbage collection time.
# FGC Number of full GC events.
# FGCT Full garbage collection time.
#
# 04/21/12 16:15:26, S0C S1C S0U S1U EC EU OC OU PC PU YGC YGCT FGC FGCT GCT
# 04/21/12 16:15:26,3328.0 3328.0 0.0 3248.5 1302784.0 732415.6 5863232.0 4035920.6 21248.0 8874.5 195 38.069 6 70.234 108.303
#
# Output the result to jstat-parsed.log
$infile = $ARGV[0];
$outfile = "jstat-parsed.csv";
open (INFILE, "<$infile") or die "can't open input file $infile";
open (OUTFILE, ">$outfile") or die "can't open output file $outfile";
print OUTFILE "Time,GCYoungGenCount,GCYoungGenTime,GCOldGenCount,GCOldGenTime,OldGenCapacity,OldGenUtilization\n";
print "Time,YGCount,YGTime,FGCount,FGTime\n";
#read header
<INFILE>;
#prime variables on first line of input
$line = <INFILE>;
@cells = split(/\s+/, $line);
$YGC = $cells[11];
$YGCT = $cells[12];
$FGC = $cells[13];
$FGCT = $cells[14];
#print "PRIME:timestamphere,$YGC,$YGCT,$FGC,$FGCT\n";
# now read in each line, calculating the diff from previous line and outputting values
while ($line = <INFILE>) {
#$line = <INFILE>;
# get new row's values
@cells = split(/\s+/, $line);
$time = $cells[0] . " " . $cells[1];
$time =~ s/,.*//g;
$nYGC = $cells[11];
$nYGCT = $cells[12];
$nFGC = $cells[13];
$nFGCT = $cells[14];
$OGCapacity = $cells[7];
$OG = $cells[8];
#print "NEW:$time,$nYGC,$nYGCT,$nFGC,$nFGCT\n";
# calculate differences from previous row's values
$diffYGC = $nYGC - $YGC;
$diffYGCT = $nYGCT - $YGCT;
$diffFGC = $nFGC - $FGC;
$diffFGCT = $nFGCT - $FGCT;
print OUTFILE "$time,$diffYGC,$diffYGCT,$diffFGC,$diffFGCT,$OGCapacity,$OG\n";
print "$time,$diffYGC,$diffYGCT,$diffFGC,$diffFGCT,$OGCapacity,$OG\n";
# now reset variables to current line's values
$YGC = $nYGC;
$YGCT = $nYGCT;
$FGC = $nFGC;
$FGCT = $nFGCT;
}
close (OUTFILE);
close (INFILE);
This perl script will give output such as the following:
Time,GCYoungGenCount,GCYoungGenTime,GCOldGenCount,GCOldGenTime,OldGenCapacity,OldGenUtilization
04/21/12 15:39:13,68,3.349,2,0.0530000000000002,10754040.0,5733223.0
04/21/12 15:44:13,68,3.261,2,0.0499999999999998,10754040.0,4523825.4
04/21/12 15:49:13,69,3.41,2,0.0550000000000002,10754040.0,3766710.6
04/21/12 15:54:13,68,3.23700000000001,2,0.0509999999999999,10754040.0,3008307.3
04/21/12 15:59:13,68,3.169,2,0.052,10754040.0,2428630.4
Wednesday, May 23, 2012
Monitoring Linux Server Usage With Sar
A simple way to monitor server resource usage is with sar. The following simple shell script sar.sh will monitor cpu, memory, network, and disk every 10 seconds and write each to a separate log file which can be easily imported into a spreadsheet for charting.
# Run sar every 10 seconds until stopped
# cpu
sar -u 10 > sar.cpu.log &
# free memory
sar -r 10 > sar.freememory.log &
# disk total
sar -b 10 > sar.disk.log &
# network by device
# - Note that you need to filter by the adaptor in use.
# - Run "sar -n DEV 10" to see which adaptor is being used
sar -n DEV 10 |grep eth1 > sar.network.log &
Script
# Run sar every 10 seconds until stopped
# cpu
sar -u 10 > sar.cpu.log &
# free memory
sar -r 10 > sar.freememory.log &
# disk total
sar -b 10 > sar.disk.log &
# network by device
# - Note that you need to filter by the adaptor in use.
# - Run "sar -n DEV 10" to see which adaptor is being used
sar -n DEV 10 |grep eth1 > sar.network.log &
Output
The cpu log file shows user and system CPU % utilization:
03:07:55 PM CPU %user %nice %system %iowait %steal %idle
03:08:55 PM all 73.99 0.00 2.43 0.21 0.00 23.37
03:09:55 PM all 81.79 0.00 2.67 0.21 0.00 15.34
03:10:55 PM all 82.29 0.00 2.68 0.17 0.00 14.86
The free memory log file shows how much memory is free and used:
03:07:55 PM kbmemfree kbmemused %memused kbbuffers kbcached kbcommit %commit
03:08:55 PM 110106128 88246712 44.49 356468 42850352 30363972 7.61
03:09:55 PM 110053452 88299388 44.52 356472 42879192 30371420 7.61
03:10:55 PM 109989584 88363256 44.55 356484 42914152 30372688 7.61
The disk log file shows read and write transfers per second and bytes read and written per second
03:07:55 PM tps rtps wtps bread/s bwrtn/s
03:08:55 PM 7889.59 0.00 7889.59 0.00 58582.09
03:09:55 PM 8454.59 0.00 8454.59 0.00 62458.76
03:10:55 PM 8456.30 0.00 8456.30 0.00 62645.15
03:11:55 PM 7257.61 0.00 7257.61 0.00 57384.76
The network log file shows packets received and transmitted per second and bytes received and transmitted per second.
03:00:01 PM IFACE rxpck/s txpck/s rxkB/s txkB/s rxcmp/s txcmp/s rxmcst/s
03:08:55 PM eth1 3285.46 2965.12 956.75 1824.97 0.00 0.00 1.05
03:09:55 PM eth1 3640.33 3307.06 1053.38 2074.92 0.00 0.00 1.14
03:10:55 PM eth1 3617.67 3283.23 1047.62 2061.22 0.00 0.00 1.65
03:11:55 PM eth1 2917.34 2657.74 842.35 1686.10 0.00 0.00 1.38
03:12:55 PM eth1 3859.74 3502.98 1119.06 2194.43 0.00 0.00 1.15
Thursday, March 22, 2012
How to Test REST Web Service Using The Grinder
A simple and easy method of load testing a REST service using The Grinder open source load testing tool is as follows:
The following script gives an example of this method in the case of REST PUT request using a JSON request message. (XML request message would be similar).
Script
Output
- use the HttpRequest object
- use the appropriate REST method on the HttpRequest object:
- Method=PUT
- Method=GET
- Method=DELETE

The following script gives an example of this method in the case of REST PUT request using a JSON request message. (XML request message would be similar).
Script
# The Grinder 3.7.1
from net.grinder.script import Test
from net.grinder.script.Grinder import grinder
from net.grinder.plugin.http import HTTPPluginControl, HTTPRequest
from HTTPClient import NVPair
connectionDefaults = HTTPPluginControl.getConnectionDefaults()
httpUtilities = HTTPPluginControl.getHTTPUtilities()
# headers
headers0= \
[ ]
# Http URL
url0 = 'http://servername:8080'
# Create an HTTPRequest for each request, then replace the
request101 = HTTPRequest(url=url0, headers=headers0)
request101 = Test(101, 'PUT Test').wrap(request101)
request102 = Test(102, 'PUT Test 2').wrap(request101)
json1 = '''{
\"key1\" : \"BD6632F8569D4D609BB8ED902E9F6585\",
\"key2\" : \"65EE35B00655100625F85498A6092F80\",
\"key3\" : \"984921672\",\r\n
\"id1\" : \"6\",\r\n
\"id2\" : \"1\",\r\n
\"descr\" : \"4724711\",\r\n
}'''
json2 = '''{
\"key4\" : \"6\",\r\n
\"key5\" : \"1\",\r\n
\"key6\" : \"0\",\r\n
\"key7\" : \"2\",\r\n
\"name1\" : \"Green Bay\",\r\n
\"name2\" : \"GRBay\",\r\n
}'''
class TestRunner:
"""A TestRunner instance is created for each worker thread."""
# A method for each recorded page.
def page1(self):
"""PUT Test (request 101)."""
result = request101.PUT('/Capture/Test', json1, ( NVPair('Content-Type', 'application/json'), ))
return result
# A method for each recorded page.
def page2(self):
"""PUT Test (request 101)."""
result = request102.PUT('/Capture/Test', json2, ( NVPair('Content-Type', 'application/json'), ))
return result
def __call__(self):
"""Called for every run performed by the worker thread."""
self.page1() # PUT Test (request 101)
self.page2() # PUT Test (request 102)
Output

Monday, March 19, 2012
How To Integrate Jmeter Java Request Into Ant Build System
Install Jmeter
Install Ant-Jmeter
Download the ant-jmeter jar here: http://www.programmerplanet.org/pages/projects/jmeter-ant-task.php
The jar should be put in the ant\lib directory, for example here: <path>\apache-ant-1.8.1\lib\ant-jmeter-1.1.1.jar
Integrate Ant-Jmeter with Build system
Upload jars needed to create meter java requests
The ApacheJMeter_core.jar and ApacheJMeter_java.jar libraries in jmeter\lib\ext are needed to write jmeter java request classes, so they need to be visible.
- \ApacheJMeter_core-1.0.jar
- ApacheJMeter_java-1.0.jar
Create A JMeter Plan

Integrate Jmeter into Build project
Add a jmeter-run ant target to ant build.xml. Also copy the jmeter plan file to the output directory
<?xml version="1.0" encoding="UTF-8"?>
<project name="test.JmeterTest" default="build">

 <target name="copy-jmeter-plan">
   <!-- copy jmeter plan file -->
   <copy todir="${output.root}">
    <fileset dir="${project.root}" includes="*.jmx"/>
   </copy>

   <!-- make out directory -->
   <mkdir dir="${output.root}/out" />
  </target>

 <!-- define jmeter task -->
 <taskdef
      name="jmeter"
      classname="org.programmerplanet.ant.taskdefs.jmeter.JMeterTask"/>

 <target name="jmeter-run">
  <jmeter
       jmeterhome="c:\dev\jmeter\apache-jmeter-2.6"
       testplan="${output.root}\CaptureJSONRequest.jmx"
       resultlog="${output.root}\out\CaptureJSONRequest.jtl">
   <property name="user.classpath" value="${output.root}\lib\ApacheJMeter_core-1.0;${output.root}\lib\ApacheJMeter_java-1.0"/>
  </jmeter>

  <xslt
          in="${output.root}\out\CaptureJSONRequest.jtl"
   out="${output.root}\out\jmeter-results-report.html"
   style="C:\dev\jmeter\apache-jmeter-2.6\extras\jmeter-results-report_21.xsl"/>
 </target>
</project>
Create a Jmeter Request Class
Add Jmeter Request to jmeter plan
Jmeter should display the newly added JavaRequestTest class.
Configure output file locations
Make file locations relative to location of plan, which is in the output.root based on build file copy-support. Specify file location for summary report as something like this: ~/out/summary-report.xml
Run Jmeter
Look at report
Look at the ant report:

Subscribe to:
Posts (Atom)