Showing posts with label stress. Show all posts

Monday, October 22, 2012

Virtualization Performance Testing


Virtualization technologies (such as VMware, Parallels, Xen, KVM, Waratek, etc.) have become very popular for good reasons, including but not limited to the following:
  • Application density can be increased
  • Server resource usage can be maximized
  • Hardware costs can be reduced many-fold
  • The number of servers required to run the same load can be reduced
  • Applications become more portable
It is critical to do performance, load, and stress testing of a virtualization solution before rolling it out for several reasons:
  • Different applications behave differently in a virtualized environment and some are more suitable than others
  • Performance or stability could be affected in a virtualized environment
  • Virtual machine sizing can drastically affect application behavior
  • Application configuration can be different when run in a virtualized environment.
This post gives a brief outline of how to do performance, load and stress testing of a virtualization solution.
  1. Include online and batch test cases as well as administrative operations
  2. Test bare metal (physical server) as a baseline to be compared to virtualization results
    1. See how many instance of the application can be run on bare metal
    2. Push bare metal up to server capacity
  3. Test virtualization
    1. Run VMs on the same bare metal server or an equivalent one
    2. Push one VM up to capacity, then two VMs, then three VMs, etc., up to the highest density desired.
    3. Capture hypervisor server resource usage metrics (cpu, memory, disk, network)
    4. Verify that VM performance compares reasonably relative to bare metal
    5. Verify that VM capacity compares reasonably relative to bare metal
    6. Verify that VM application stability compares reasonably relative to bare metal
    7. If performance or stability is not acceptable, see if application tuning is needed or virtual machine tuning is needed.
    8. Include stability tests in which high load is applied for an extended period of time.
    9. Perform administrative operations while system is under high load.
    10. Once performance and stability are acceptable, publish the results and the tuning and configuration needed to achieve acceptable results.


Wednesday, January 4, 2012

networkspeedtest - a free network bandwidth test application

Download

Network performance problems can cause a variety of difficult to diagnose application performance problems.  It can be necessary to test the bandwidth of the network to verify whether the bandwidth is as expected.
Network speed test is a free, simple network test application that will copy files from one test server to another, showing the network bandwidth used in bytes per second.  This could be compared to a previous baseline to show a network problem.  For example, if 50 MB/sec of bandwidth was previously seen between two test servers, and now there is 1 MB/sec between the same two test servers, there is likely a network problem.

Installation
Unzip networkspeedtest directory to c:\temp


USAGE
copyto <SERVERNAME> repeat

(Copies current directory to SERVERNAME\c$\temp\networkspeedtest showing network speed in bytes per second.)
(repeat parameter causes it to repeat the operation indefinitely)


EXAMPLE
(Shows network bandwidth of 48 MB/sec from current server to SERVER1)

C:\Temp\networkspeedtest> copyto SERVER1 repeat

-- Speed of copying files of varying sizes to SERVER1 in bytes per second
    Speed :            48339531 bps.
    Speed :            58255333 bps.
    Speed :            41308327 bps.
    Speed :            48339531 bps.
    Speed :            48339531 bps.
    Speed :            48339531 bps.
    Speed :            48339531 bps.
    Speed :            48339531 bps.
    Speed :            48339531 bps.
    Speed :            48339531 bps.
    Speed :            41308327 bps.
    Speed :            58255333 bps.
    Speed :            48339531 bps.
    Speed :            41308327 bps.

The following shows windows task manager networking tab during this test:

Friday, November 11, 2011

VisualCSV - A Free CSV Analyzer - CSV File to Chart, CSV File to Stats, CSV File to Histograms, CSV File Correlation Charts

VisualCSV         Download Now

VisualCSV is a free CSV analyzer that is:
  • A Java application 
  • Converts CSV File to Charts
  • Converts CSV File to Statistics
  • Converts CSV File to Histograms
  • Converts CSV File to Correlation Charts
Performance testing, system monitoring, etc. often generate CSV files that must be analyzed, and typically you need to chart columns, calculate stats on columns, correlate columns, etc.

VisualCSV is a java application that, given a csv file input, will generate most of the data you need automatically, including:
  • statistics on each column in the CSV file 
    • min
    • avg
    • max
    • standard deviation
    • variance, median
    • percentiles (such as 95th and 98th percentiles, or any list of percentiles you specify)
  • trend charts for each column in jpeg format
  • histogram charts for each column
  • correlation metrics between any pairs of columns
  • correlation charts showing correlations between any pairs of columns
  • transposed correlation charts reversing x and y axis.
  • charts created using jfreechart
  • stats created using apache commons math
The following sections shos sample output generated from processing a csv file from windows performance monitor (perfmon) having the following columns:
(PDH-CSV 4.0) (Pacific Standard Time)(480)
\\CHELSTRPL006\Memory\Available Bytes
\\CHELSTRPL006\Network Interface(HP NC382i DP Multifunction Gigabit Server Adapter _4)\Bytes Total/sec
\\CHELSTRPL006\Network Interface(HP NC382i DP Multifunction Gigabit Server Adapter _4)\Output Queue Length
\\CHELSTRPL006\PhysicalDisk(_Total)\% Disk Time
\\CHELSTRPL006\PhysicalDisk(_Total)\Avg. Disk sec/Read
\\CHELSTRPL006\PhysicalDisk(_Total)\Avg. Disk sec/Write
\\CHELSTRPL006\Processor(_Total)\% Privileged Time
\\CHELSTRPL006\Processor(_Total)\% Processor Time

Summary stats
The following csv file showing summary stats for each column is generated.


Trend Charts
For each column, a chart is generated such as this:

Histograms
For each column, a frequency histogram showing number of occurrences by bucket is generated such as this:
The number of buckets is configurable.

For each chart, a relative frequency histogram  is generated showing relative frequency by bucket is generated such as this:

Correlations Between Columns
For each pair of columns, a csv file showing correlations between pairs of columns is generated such as this:

Correlation Charts
For each pair of columns, a correlation chart and a transposed correlation chart (x and y swapped) is generated such as this:

Download
VisualCSV can be downloaded here:

Usage
  • VisualCSV requires java in the system path.  It has been tested with java 1.6 and probably runs fine with 1.5 and 1.7 as well.
  • Download and unzip the files.
  • Analyze the sample CSV file from command line by running:
    • run.bat TestPerfmonFile.csv
  • This will analyze the test file and generate output in directory .\out.  The output should 

Configuration

Client configuration is found in the file client.config.

Columns can be specifically included or excluded by putting them in specified include or exclude files which by default (as specified in client.config) are called 
Column-Include-Names.properties
Column-Exclude-Names.properties

The include file can be empty or missing in which case all columns are analyzed.  Otherwise, the columns analyzed are all columns in the include file minus those in the exclude file.

Likewise columns can be specifically included or excluded from being correlated with each other by putting them in specified include or exclude files which by default (as specified in client.config)  are called 
Correlation-Include-Names.properties
Correlation-Exclude-Names.properties

Again, the include file can be empty or missing in which case all columns are correlated. Otherwise, the columns in the exclude file are subtracted from the includes.

The client.config file includes the following values by default:


# --- Functionality
createTrendCharts=true
computeCorrelations=true
createCorrelationCharts=true


# --- whether to include or exclude columns from analysis
# --- put columns in this file to include them in analysis.  empty file or no file means analyze all columns.
columnIncludeFile=Column-Include-Names.properties


# --- put columns in this file to exclude them from analysis.
columnExcludeFile=Column-Exclude-Names.properties


# --- whether to include or exclude columns from correlation with other columns
correlationIncludeFile=Correlation-Include-Names.properties
correlationExcludeFile=Correlation-Exclude-Names.properties


# --- Timestamp column index (0 = first column)
hasTimestampColumn=true
timestampColumnIndex=0


# --- Java SimpleDateFormat date format for parsing timestamps
timestampFormat=MM/dd/yyyy HH:mm:ss.S

# Letter Date or Time Component Presentation Examples
# G Era designator Text AD
# y Year Year 1996; 99
# M Month in year Month July; Jul; 07
# w Week in year Number 27
# W Week in month Number 2
# D Day in year Number 189
# d Day in month Number 10
# F Day of week in month Number 2
# E Day in week Text Tuesday; Tue
# a Am/pm marker Text PM
# H Hour in day (0-23) Number 0
# k Hour in day (1-24) Number 24
# K Hour in am/pm (0-11) Number 0
# h Hour in am/pm (1-12) Number 12
# m Minute in hour Number 30
# s Second in minute Number 55
# S Millisecond Number 978
# z Time zone General time zone Pacific Standard Time; PST; GMT-08:00
# Z Time zone RFC 822 time zone -0800


# --- chart settings
chartEveryNthDataPoint=1
histogramLogScale=false


# --- statistics settings
createChartCorrelationGreaterThan=0.0
createChartCorrelationLessThan=-0.0
numHistogramBuckets=10
percentiles=80,90,95,98,99


# --- Output file locations
outDir=out
deleteStatsDirs=true
outTrendDir=out/Trend
outCorrelationDir=out/Correlation
outHistogramDir=out/Histogram
outputStatsFile=SummaryStats.csv


Monday, November 7, 2011

Monitoring Linux Servers during Performance Tests

The server resource usage of the servers used in a load or performance test should be monitored and saved to be able to later verify system bottlenecks and behavior.  Linux servers can be monitored in a number of different ways.

If you are using Performance Center to drive load, linux monitors can be enabled as part of the load test, allowing the linux metrics to be conveniently combined with other metrics in a single report.  That requires the rstat daemon to be running on the linux servers monitored.  For CentOS, rstat daemon can be installed as follows:

sudo yum install rpcbind
sudo wget http://www.wyzaerd.com/public/rpc.rstatd-4.0.1.tar.gz
sudo tar xvzf rpc.rstatd-4.0.1.tar.gz
cd rpc.rstatd-4.0.1
sudo ./configure
sudo make
sudo make install
sudo /usr/local/sbin/rpc.rstatd

Monitors can then be configured in performance center to collect stats from the linux server running rstatd.

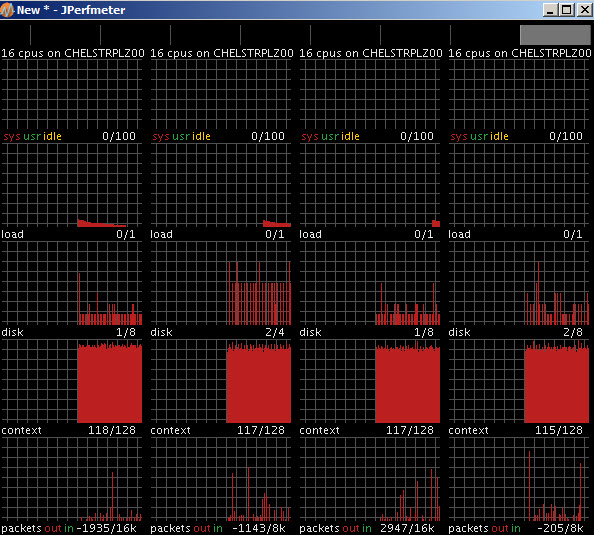
Another tool for viewing and collecting server resource usage on linux is jperfmeter (http://jperfmeter.sourceforge.net/).  Jperfmeter provides a gui view of resource usage metrics of a list of servers, showing values over time.  For example the following shows the jmeter console for a group of 4 linux servers:

The jmeter metrics can be saved to a delimited text file for later analysis:

A third tool for monitoring linux server resource usage is sar. The following script will collect server resource usage on CPU, memory, network, and disk utilization:


# Run sar every 10 seconds until stopped
# cpu
sar -u 10  > sar.cpu.log &
# free memory
sar -r 10  > sar.freememory.log &
# disk total
sar -b 10  > sar.disk.log &
# network by device
#    - Note that you need to filter by the adaptor in use.  
#    - Run "sar -n DEV 10" to see which adaptor is being used
sar -n DEV 10 |grep eth1 > sar.network.log &

On some versions of sar, it is necessary to provide a number of data points to collect such as the following:

# Run sar every 10 seconds until stopped
# cpu
sar -u 10 99999 > sar.cpu.log &
# free memory
sar -r 10 99999 > sar.freememory.log &
# disk total
sar -b 10 99999 > sar.disk.log &
# network by device
#    - Note that you need to filter by the adaptor in use.  
#    - Run "sar -n DEV 10" to see which adaptor is being used
sar -n DEV 10 99999 |grep eth1 > sar.network.log &


For a test of one or two hours, a 10 second collection interval is convenient, providing a couple of hundred data points.  For an overnight test, a 300 second collection interval is usually appropriate.

Output

The cpu log file shows user and system CPU % utilization:

03:07:55 PM     CPU     %user     %nice   %system   %iowait    %steal     %idle
03:08:55 PM     all     73.99      0.00      2.43      0.21      0.00     23.37
03:09:55 PM     all     81.79      0.00      2.67      0.21      0.00     15.34
03:10:55 PM     all     82.29      0.00      2.68      0.17      0.00     14.86

The free memory log file shows how much memory is free and used:

03:07:55 PM kbmemfree kbmemused  %memused kbbuffers  kbcached  kbcommit   %commit
03:08:55 PM 110106128  88246712     44.49    356468  42850352  30363972      7.61
03:09:55 PM 110053452  88299388     44.52    356472  42879192  30371420      7.61
03:10:55 PM 109989584  88363256     44.55    356484  42914152  30372688      7.61

The disk log file shows read and write transfers per second and bytes read and written per second

03:07:55 PM       tps      rtps      wtps   bread/s   bwrtn/s
03:08:55 PM   7889.59      0.00   7889.59      0.00  58582.09
03:09:55 PM   8454.59      0.00   8454.59      0.00  62458.76
03:10:55 PM   8456.30      0.00   8456.30      0.00  62645.15
03:11:55 PM   7257.61      0.00   7257.61      0.00  57384.76

The network log file shows packets received and transmitted per second and bytes received and transmitted per second.

03:00:01 PM     IFACE   rxpck/s   txpck/s    rxkB/s    txkB/s   rxcmp/s   txcmp/s  rxmcst/s
03:08:55 PM      eth1   3285.46   2965.12    956.75   1824.97      0.00      0.00      1.05
03:09:55 PM      eth1   3640.33   3307.06   1053.38   2074.92      0.00      0.00      1.14
03:10:55 PM      eth1   3617.67   3283.23   1047.62   2061.22      0.00      0.00      1.65
03:11:55 PM      eth1   2917.34   2657.74    842.35   1686.10      0.00      0.00      1.38
03:12:55 PM      eth1   3859.74   3502.98   1119.06   2194.43      0.00      0.00      1.15

These can be charted to provide a simple overview of server resource usage as follows: