Showing posts with label java. Show all posts

Friday, September 14, 2012

Dumping Very Large Java Heaps

When a java application has either a memory leak or much higher than expected memory utilization, it is necessary to obtain heap information to identify the source of the problem.  A heap dump is ideal because it can then be analyzed using various tools.  However, with very large java heaps, perhaps > 100GB, a heap dump may be impractical for several reasons:

  • the heap dump may crash the java process before completing
  • the heap dump may hang indefinitely
  • there may not be enough disk space to accomodate the dump
  • the dump may be so large that analysis tools are unable to process it
One solution to this scenario is to use the jmap utility to obtain a heap dump histogram from the running process.  This appears to be very lightweight, completing quickly on very large heaps and generating a very small summary analysis file that can be used for troubleshooting.

The syntax for doing this is the following, where <pid> is the process id of the java process.

jmap -histo <pid>

The output is a very nice summary showing, for each class in the heap, the class name, the number of instances, and the size in bytes, for example as follows:

 num     #instances         #bytes  class name
----------------------------------------------
   1:         70052       11118624  <constMethodKlass>
   2:         70052        8422160  <methodKlass>
   3:          6320        8258472  <constantPoolKlass>
   4:          6320        6117216  <instanceKlassKlass>
   5:        116656        5732520  <symbolKlass>
   6:         17467        5729824  [I
   7:          5682        5050352  <constantPoolCacheKlass>
   8:         57275        4818512  [C
   9:         24818        2660384  [B
  10:         59327        1898464  java.lang.String
  11:          2847        1766720  [J
  12:          2978        1542008  <methodDataKlass>
  13:         11687         797256  [S
  14:         13307         706440  [Ljava.lang.Object;
  15:          6777         704808  java.lang.Class
  16:         18904         604928  java.util.HashMap$Entry
  17:         10088         522512  [[I
  18:          5736         499408  [Ljava.util.HashMap$Entry;
  19:         12838         410816  java.util.Hashtable$Entry
  20:          5580         267840  java.util.HashMap
  21:           428         249952  <objArrayKlassKlass>
  22:          5888         235520  java.util.concurrent.ConcurrentHashMap$Segment
  23:          6243         199776  java.util.concurrent.locks.ReentrantLock$NonfairSync
  24:          5888         146544  [Ljava.util.concurrent.ConcurrentHashMap$HashEntry;
  ...
3029:             1             16  sun.awt.X11.XToolkit$4
3030:             1             16  java.util.Collections$EmptyIterator
3031:             1             16  com.sun.tools.visualvm.core.explorer.ExplorerContextMenuFactory
3032:             1             16  sun.reflect.generics.tree.TypeVariableSignature
3033:             1             16  sun.awt.X11.XKeyboardFocusManagerPeer$1
3034:             1             16  org.openide.xml.EntityCatalog$Forwarder
Total        714547       74730032

Tuesday, August 14, 2012

How to Measure Response Times in Java

This post describes how to measure response time in Java.  You can use either System.currentTimeMillis() or System.nanoTime() depending on what response times you will be recording.

System.currentTimeMillis is accurate to 1 millisecond, so is typically appropriate if you have response times on the order of magnitude of 1 second or more.  Using currentTimeMillis, you could report results in seconds with three decimals of precision, such as 1.205 seconds, or results in milliseconds with zero decimals of precision, such as 1205 milliseconds. 

nanoTime is typically appropriate if you want to report response times with greater precision than milliseconds, useful in cases in which differences of a fraction of a millisecond or microsecond are needed.

The following java code sample shows how to capture the response time of a transaction using both currentTimeMillis and nanoTime, showing the results in milliseconds with three decimals of precision.

Code Sample


/**
 * Created with IntelliJ IDEA.
 * User: ehammer
 */

import java.net.*;
import java.io.*;

public class TimerTest
{
    public static final Double NANO_TO_MILLIS = 1000000.0;
    public static void main(String[] args) throws MalformedURLException, IOException
    {
        // start timer
        long nanoStart = System.nanoTime();
        long milliStart = System.currentTimeMillis();

        // do work to be timed
        doWork();

        // stop timer
        long nanoEnd = System.nanoTime();
        long milliEnd = System.currentTimeMillis();

        // report response times
        long nanoTime = nanoEnd - nanoStart;
        long milliTime = milliEnd - milliStart;
        reportResponseTimes(nanoTime, milliTime);
    }

    private static void reportResponseTimes(long nanoTime, long milliTime)
    {
        // convert nanoseconds to milliseconds and display both times with three digits of precision (microsecond)
        String nanoFormatted = String.format("%,.3f", nanoTime / NANO_TO_MILLIS);
        String milliFormatted = String.format("%,.3f", milliTime / 1.0 );

        System.out.println("Milliseconds using nanoTime(): " + nanoFormatted);
        System.out.println("Milliseconds using currentTimeMillis: " + milliFormatted);
    }

    private static void doWork() throws MalformedURLException, IOException
    {
        URL url = new URL("http://www.google.com/");
        URLConnection conn = url.openConnection();
        BufferedReader in = new BufferedReader(new InputStreamReader(conn.getInputStream()));
        while (in.readLine() != null) {}
        in.close();
    }
}


Sample Output


Milliseconds using nanoTime(): 277.913
Milliseconds using currentTimeMillis: 278.000

Process finished with exit code 0

Walk Through

Timer is started as follows:
        long nanoStart = System.nanoTime();
        long milliStart = System.currentTimeMillis();

The transaction to be timed is then run.

The timer is stopped:
        long nanoEnd = System.nanoTime();
        long milliEnd = System.currentTimeMillis();

The difference between end and start is taken:
        long nanoTime = nanoEnd - nanoStart;
        long milliTime = milliEnd - milliStart;

Results are formatted in the desired precision, in this case as milliseconds with three decimals of precision (microsecond precision):
        String nanoFormatted = String.format("%,.3f", nanoTime / NANO_TO_MILLIS);
        String milliFormatted = String.format("%,.3f", milliTime / 1.0 );

Note that nanoTime results show microsecond precision, while currentTimeMillis shows results in 1 millisecond increments.

Thursday, May 24, 2012

Jstat Java Heap and Garbage Collection Analysis

Java memory utilization and garbage collection activity can be analyzed fairly nicely with a set of seven charts showing utilization and capacity of the different generations, and garbage collection activity in the generations:

  • Garbage Collection - Old Generation (number of collections and time spent in collection)
  • Garbage Collection - Young Generation (number of collections and time spent in collection)
  • Utilization and Capacity - Old Generation Space
  • Utilization and Capacity - Survivor Space 0
  • Utilization and Capacity - Survivor Space 1
  • Utilization and Capacity - Eden Space
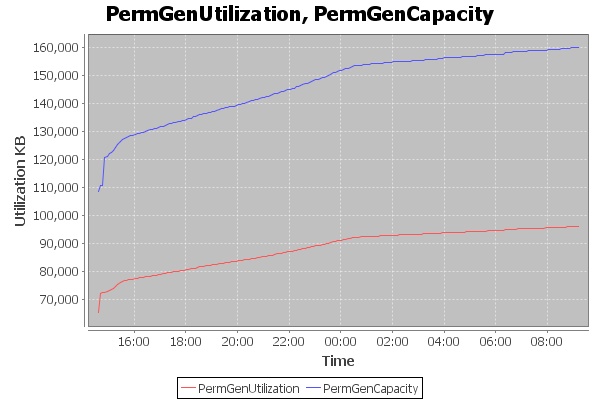
  • Utilization and Capacity - Permanent Space

The following is an example of these seven charts:

Garbage collections in the old generation, number of collections per interval and time spent in collections per interval:

Garbage collections in the young generation, number of collections per interval and time spent in collections per interval:
Old generation utilization and capacity:
Survivor space 1 utilization and capacity:
Survivor space 0 utilization and capacity:
Eden space utilization and capacity:
Permanent space utilization and capacity:


Jstat is a tool that comes with the Java JDK that can be used to monitor the java heap, including information on the generations, the number of garbage collections and the time taken by garbage collections.  With its output the above seven charts can be created.

Jstat can be collected as follows for a given java process pid:

jstat -gc 2862 60000


In this case information is output every 60 seconds for java process 2862:

S0C    S1C    S0U    S1U      EC       EU        OC         OU       PC     PU    YGC     YGCT    FGC    FGCT     GCT   
104832.0 104832.0 26921.8  0.0   838912.0 224806.4 9437184.0   797674.3  85568.0 85341.5    112    3.127   0      0.000    3.127
104832.0 104832.0  0.0   52798.7 838912.0 828526.5 9437184.0   843524.4  86144.0 86031.4    122    3.402   0      0.000    3.402
,104832.0 104832.0  0.0   26349.2 838912.0 282471.0 9437184.0   902120.4  86336.0 86084.9    133    3.759   0      0.000    3.759

The columns that are output can be interpreted as follows:

ColumnDescription
S0CCurrent survivor space 0 capacity (KB).
S1CCurrent survivor space 1 capacity (KB).
S0USurvivor space 0 utilization (KB).
S1USurvivor space 1 utilization (KB).
ECCurrent eden space capacity (KB).
EUEden space utilization (KB).
OCCurrent old space capacity (KB).
OUOld space utilization (KB).
PCCurrent permanent space capacity (KB).
PUPermanent space utilization (KB).
YGCNumber of young generation GC Events.
YGCTYoung generation garbage collection time.
FGCNumber of full GC events.
FGCTFull garbage collection time.
GCTTotal garbage collection time.


It is convenient to have a script that determines the java pid rather than having to enter it manually.  A script such as the following can do that:

ps -ef|grep java|grep -v grep|awk '{print "jstat -gc "$2" 10000}'

This will find the java process running and generate a jstat command on that process id.  If the system may have multiple java processes, additional filters are needed to isolate a single pid.

It is also convenient to prepend a timestamp to jstat rows.  While there is a  jstat flag to output milliseconds since java startup, a human-readable timestamp is more useful for later correlation to other system events.  This can be done using the following timestamp.sh perl script:


#!/usr/bin/perl
#while (<>) { print localtime() . ": $_"; }
while (<>) 
{
($sec,$min,$hour,$mday,$mon,$year,$wday,$yday,$isdst) = localtime(time);
$secpad = sprintf( "%02d", $sec );
$minpad = sprintf( "%02d", $min );
$hourpad = sprintf( "%02d", $hour );
$monpad = sprintf( "%02d", $mon );
$mdaypad = sprintf( "%02d", $mday );
$yearpad = sprintf( "%02d", ($year + 1900) % 100 );
$time = "$monpad\/$mdaypad\/$yearpad $hourpad:$minpad:$secpad";
print $time . ",$_";
#17/04/112 16:40:14
}

The timestamp.sh script can be integrated into the jstat output as follows:

jstat -gc 2862 10000 | timestamp.sh

This can be combined with java pid filter and run in the background outputting to a log file as follows:

ps -ef|grep java|grep -v grep|awk '{print "jstat -gc "$2" 10000 | ./timestamp.sh > jstat.log"}' | sh &

The result is data such as the following:


04/22/12 15:07:49, S0C    S1C    S0U    S1U      EC       EU        OC         OU       PC     PU    YGC     YGCT    FGC    FGCT     GCT   
04/22/12 15:07:49,104832.0 104832.0 26921.8  0.0   838912.0 224806.4 9437184.0   797674.3  85568.0 85341.5    112    3.127   0      0.000    3.127
04/22/12 15:08:49,104832.0 104832.0  0.0   52798.7 838912.0 828526.5 9437184.0   843524.4  86144.0 86031.4    122    3.402   0      0.000    3.402
04/22/12 15:09:49,104832.0 104832.0  0.0   26349.2 838912.0 282471.0 9437184.0   902120.4  86336.0 86084.9    133    3.759   0      0.000    3.759
04/22/12 15:10:49,104832.0 104832.0 48749.7  0.0   838912.0 544053.8 9437184.0   954768.5  86336.0 86092.8    144    4.083   0      0.000    4.083
04/22/12 


Analyze jstat log

To get the total time and number of Full GC and young generation GCs, the cumulative values output by jstat need to be diff'd versus the previous line.  The jstat log can be analyzed into a simple csv file with this per-interval GC information using a perl script such as the following:


# Read in jstat log file
# Calculate the difference from previous lines for full and young gen GCs, both count and time
#    YGC Number of young generation GC Events.
#    YGCT Young generation garbage collection time.
#    FGC Number of full GC events.
#    FGCT Full garbage collection time.
#
#  04/21/12 16:15:26, S0C    S1C    S0U    S1U      EC       EU        OC         OU       PC     PU    YGC     YGCT    FGC    FGCT     GCT   
#  04/21/12 16:15:26,3328.0 3328.0  0.0   3248.5 1302784.0 732415.6 5863232.0  4035920.6  21248.0 8874.5    195   38.069   6     70.234  108.303
#
#  Output the result to jstat-parsed.log

$infile = $ARGV[0];
$outfile = "jstat-parsed.csv";

open (INFILE, "<$infile") or die "can't open input file $infile";
open (OUTFILE, ">$outfile") or die "can't open output file $outfile";

print OUTFILE "Time,GCYoungGenCount,GCYoungGenTime,GCOldGenCount,GCOldGenTime,OldGenCapacity,OldGenUtilization\n";
print "Time,YGCount,YGTime,FGCount,FGTime\n";
#read header
<INFILE>;
#prime variables on first line of input
$line = <INFILE>;
@cells = split(/\s+/, $line);
$YGC = $cells[11];
$YGCT = $cells[12];
$FGC = $cells[13];
$FGCT = $cells[14];
#print "PRIME:timestamphere,$YGC,$YGCT,$FGC,$FGCT\n";

# now read in each line, calculating the diff from previous line and outputting values
while ($line = <INFILE>) {
#$line = <INFILE>;
# get new row's values
@cells = split(/\s+/, $line);
$time = $cells[0] . " " . $cells[1];
$time =~ s/,.*//g;
$nYGC = $cells[11];
$nYGCT = $cells[12];
$nFGC = $cells[13];
$nFGCT = $cells[14];
$OGCapacity = $cells[7];
$OG = $cells[8];
#print "NEW:$time,$nYGC,$nYGCT,$nFGC,$nFGCT\n";

# calculate differences from previous row's values
$diffYGC = $nYGC - $YGC;
$diffYGCT = $nYGCT - $YGCT;
$diffFGC = $nFGC - $FGC;
$diffFGCT = $nFGCT - $FGCT;
print OUTFILE "$time,$diffYGC,$diffYGCT,$diffFGC,$diffFGCT,$OGCapacity,$OG\n";
print "$time,$diffYGC,$diffYGCT,$diffFGC,$diffFGCT,$OGCapacity,$OG\n";

# now reset variables to current line's values
$YGC = $nYGC;
$YGCT = $nYGCT;
$FGC = $nFGC;
$FGCT = $nFGCT;
}
close (OUTFILE);
close (INFILE);


This perl script will give output such as the following:

Time,GCYoungGenCount,GCYoungGenTime,GCOldGenCount,GCOldGenTime,OldGenCapacity,OldGenUtilization
04/21/12 15:39:13,68,3.349,2,0.0530000000000002,10754040.0,5733223.0
04/21/12 15:44:13,68,3.261,2,0.0499999999999998,10754040.0,4523825.4
04/21/12 15:49:13,69,3.41,2,0.0550000000000002,10754040.0,3766710.6
04/21/12 15:54:13,68,3.23700000000001,2,0.0509999999999999,10754040.0,3008307.3
04/21/12 15:59:13,68,3.169,2,0.052,10754040.0,2428630.4


Monday, January 2, 2012

How To Unit Test Your Loadrunner Java Scripts with the Junit Test Framework

This post provides a method for testing LoadRunner java protocol scripts with junit java testing framework.  Junit tests are typically  integrated into your continuous integration environment so that your LoadRunner scripts are tested on every check-in.  This ensures that code check-ins do not break your scripts.  Your scripts are guaranteed to be  functional at any time for load testing.

Suppose that the following is your target LoadRunner java protocol script:


import lrapi.lr;


public class Actions
{
    public int init() throws Throwable 
    {
        return 0;
    }//end of init


    public int action() throws Throwable 
    {
try
        {
            lr.start_transaction("test");
   lr.log_message("This is the test transaction");
   lr.end_transaction("test", lr.PASS);
        }
        catch (Exception e)
        {
            lr.end_transaction("test", lr.FAIL);
            lr.error_message("ERROR: Received exception "+e.toString());
            
        }
return 0;
    }//end of action


    public int end() throws Throwable 
    {
return 0;
    }//end of end
}

This java loadrunner scripts runs with the following output:


Running Vuser...
Starting iteration 1.
Starting action Actions.
Notify: Transaction "test" started.
This is the test transaction
Notify: Transaction "test" ended with "Pass" status (Duration: 0.0073).
Ending action Actions.
Ending iteration 1.
Ending Vuser...


To test your script with junit, two main issues problems have to be solved:

  • Api calls into lrapi.lr have to be stubbed out
  • A junit test case has to be defined calling the loadrunner script methods

These issues can be solved as follows:
  • Create a class LoadRunnerJunitTests
  • Create a junit test method that calls into the loadrunner classes.
  • Remove the lrapi.lr import
  • Create a stub class "lr" implementing the lrapi.lr api methods and member variables used
  • Remove the public visibility of the Actions class
  • Add unit test failure calls in places where the script fails

The resulting class tests your script using the junit framework as follows:

package test;

import org.junit.Assert;
import org.junit.Test;

/*
 *  Example of how to test a LoadRunner Java protocol script using junit
 */
//TESTABILTY CHANGE: add the following junit test class to run the script methods
public class LoadRunnerJunitTests
{
@Test
public void testLoadrunner() throws Throwable
{
    Actions a = new Actions();
a.init();
a.action();
a.end();
    }
}

// Target LoadRunner script to be tested.
//TESTABILTY CHANGE: removed public visibilty of Actions class
class Actions
{
 public int init() throws Throwable 
 {
     return 0;
 }//end of init


 public int action() throws Throwable 
 {
     try
     {
         lr.start_transaction("test");
         lr.log_message("This is the test transaction");
         lr.end_transaction("test", lr.PASS);
     }
     catch (Exception e)
     {
         lr.end_transaction("test", lr.FAIL);
         lr.error_message("ERROR: Received exception : "+e.toString());

         //TESTABILITY CHANGE: fail the unit test if the script fails
         Assert.fail("Loadrunner script failure");
         
     }
return 0;
 }//end of action


 public int end() throws Throwable 
 {
return 0;
 }//end of end
}

//TESTABILTY CHANGE: add the following lr class implementing the needed loadrunner api methods and member variables
class lr
{
public static String PASS = "PASS";
public static String FAIL = "FAIL";
public static String AUTO = "AUTO";
public static void start_transaction(String str)
{
System.out.println("starting transaction " + str);
}
public static void end_transaction(String str, String status)
{
System.out.println("ending transaction " + str + " with status " + status);
}
public static void log_message(String str)
{
System.out.println("log message " + str);
}
public static void error_message(String str)
{
System.out.println("error message " + str);
}
public static void set_transaction_status(String str)
{
System.out.println("set_transaction_status " + str);
}
public static void abort()
{
System.out.println("aborting ");
System.exit(1);
}
}

The junit test of the loadrunner script runs with the following output:

starting transaction test
log message This is the test transaction
ending transaction test with status PASS