Showing posts with label scalability. Show all posts

Monday, February 6, 2012

How to Performance Test in a Service-Oriented Architecture

How do you performance test, stress test, and load test in the world of service-oriented architecture (SOA)?

The answer is that you test it at different levels of granularity, typically three levels.  One, obvious level is the service.  Another level is end to end.  The third level is the module level, the low-level building blocks making up the service.

One necessary precondition to adequate performance testing services is proper instrumentation providing key performance metrics.  Response times, transaction rates, and and success/failure counts must be available for all service entry points and downstream calls.  This allows response time contributions to be allocated accurately to the proper services and allows fast performance problem debugging.

The three layers of SOA performance testing share the following in common.

  • Scalability Testing
    • What is capacity?
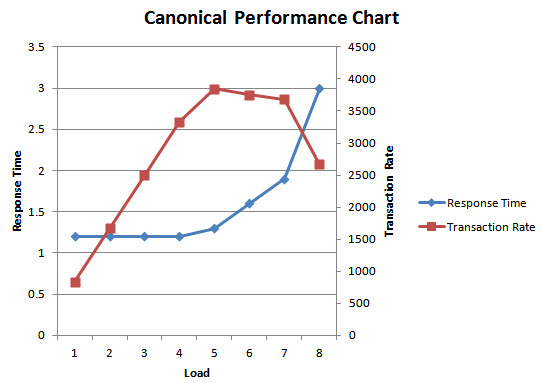
    • What bottleneck is limiting capacity?
    • What is response time at various loads?
    • What is the canonical performance chart?


  • Stability Testing
    • Is the application stable?
    • Is the application fault tolerant?


  • Performance Regression Testing
    • Does performance degrade from build to build?
    • Does server resource usage increase from build to build?


  • Metrics on server resource usage
    • CPU
    • Memory
    • Network
    • Disk


Module level SOA performance testing is done as follows:

  • Test key functional code paths at module level
  • Use multi-threaded, concurrent execution
  • Run within unit test framework
  • Run within continuous integration framework
  • Run frequently, each check-in, build, or version


Service level SOA performance test is done as follows:

  • Test through public entry point
  • Isolate service under test from other services
  • Use spoofing or stubbing of backend services, mimicking their response time behavior
  • Determine response time and availability service level agreements (SLAs) based on test results
  • Thoroughly test the clustering or load balancing mechanism used to scale the service out horizontally.


End to end level SOA performance test is done as follows:

  • Test public entry point into the application
  • Verify that bottlenecks hit are consistent with capacity of individual services discovered in service-level testing.
  • Verify fault tolerance of unavailable downstream services


An additional layer is infrastructure testing.  This could include messaging infrastructure, caching infrastructure, storage infrastructure, database infrastructure, etc.  Key infrastructure should be directly tested for scalability and stability in some cases to ensure that it behaves as expected and scales as expected.

SOA performance testing can be summarized in the following conceptual chart:

Tuesday, January 24, 2012

Using Loadrunner Pacing to Hit a Specific Transaction Rate

It is often necessary to apply load at a specific transaction rate per second (TPS).  For example, it may be necessary to test every build or patch of an application by running a fixed benchmark of 20 queries per second against the application, measuring the response time and server utilization at that fixed load.  By then examining the trend over time of response time and server resource utilization under uniform load, performance regressions can be easily identified.

One way to set a specific transaction rate using Loadrunner is by using the pacing feature.
Pacing specified how often an iteration starts.  For example, if an iteration runs in 300 - 500 milliseconds, setting pacing to 1 second for that script will case a user to run the iteration once every second as illustrated below:
Each second the iteration starts and then ends after 400 ms or so.  At the next second interval, the next iteration starts.  An exact transaction rate of 1 iteration per second is reached in this way.  By increasing the user count in this case to 10, a transaction rate of 10 TPS can be achieved.  

An iteration can have multiple transactions per iteration.  If the above example was an iteration that included three transactions (query1, query2, and query3), a single user would run three transactions per second and 10 users would give 30 TPS.

The following formula provides a calculator for determining what the pacing in seconds should be set to given three input parameters, transactions per iteration, user count, and target transaction rate:
  • transactionsPerIteration  (the number of transactions included in an iteration)
  • users (the number of users to be run)
  • tps (the target transaction rate per second)

For example, suppose transactionsPerIteration = 3, users = 50, and target transaction rate = 10 TPS.  The equation gives a pacing in seconds of (3 * 50)/10 = 1.5 seconds.

One thing that can prevent the target transaction rate from being reached is when the iteration slows down when run under multiple users such that the time an iteration runs is longer than the pacing time.  In this case a warning is generated and the transaction rate is not reached.  This can be sometimes be avoided by increasing the user count somewhat.

However, the problem could also be due to limitations in the application's vertical scalability.  The application may have concurrency problems preventing concurrent users from executing the transaction without blocking other users.  In a worst case, the application's concurrency problems may make it impossible to reach the target transaction rate regardless of the number of users.  In any case, it is worthwhile to investigate what the bottlenecks are that are limiting scalability and resolving those issues.

Wednesday, November 2, 2011

Extending the Load Test Plan

The previous post covered the minimal plan for load testing which included testing scalability and stability testing.  This post covers additional testing needed to ensure a stable, scalable, and well-performing application, specifically:

  1. Performance regression
  2. Fault tolerance
  3. Horizontal scalability


1. Performance Regression

A performance regression test consists of running the same performance test on the prior version of the application and then on the current version of the application using identical or at least equivalent hardware.  This will show whether performance has degraded in the current release versus the previous release.  The test should be run under load to include the impact of any concurrency or other load-related issues affecting performance.  The load could be at various levels, i.e., running the vertical scalability test already discussed on each version of the application.  Or, if a single load is used for performance regression, the load should be selected at slightly less than peak capacity.

Ideally, such a performance regression test or standard performance benchmark would be run on a variety of versions of the application over time which will provide a performance trend.  This will show whether performance is slowly degrading or improving over time.

In addition to response time performance regressions, regressions should also be looked for in server resource usage.  You want to know if the application or client is burning more CPU to do the same amount of work, or whether more memory or network resource is needed.

If there is a performance regression, it should be investigated carefully and fixed if possible. 


2. Fault Tolerance


Fault tolerance testing involves running various negative or destructive tests while the application is under load.  These could include the following:   

  • Bringing a downstream system down under load (stopping a downstream database or downstream webservice)
  • Slowing down a downstream service under load.
  • Applying a sudden heavy burst of traffic under load.
  • Triggering error scenarios under load.
  • Dropping network connections under load.  (using a tool such as tcpview)
  • Bouncing the application under load.
  • Failing over to another server under load.
  • Imparing the network (reducing bandwidth, dropping packets, etc.)
The behavior of the application is observed in each test:

  • Does the application recover automatically?  
  • Does it crash?  
  • Does it cause a cascading effect, affecting other systems? 
  • Does it enter into a degraded state and never recover?  
  • Can the event be monitored and alerted on with available tools?  
  • Are appropriate events logged?

In each case, the behavior could be as designed, or it could be unexpected and be a scenario that must be fixed prior to production deployment.  This type of testing can find issues that would otherwise not be found in the test lab and can greatly improve the stability of the application.


3. Horizontal Scalability

Vertical scalability of the application on a single server has already been tested and bugs fixed allowing the application to scale up and use a majority the resources of a single server.  A horizontal scalability test addresses the question of whether adding additional servers running the application into the cluster allows the application to scale further.  Once one server is nearing peak capacity, can another server be added to the cluster to double capacity?  How far out does this scale?  Does one server double capacity, but no further gains can be obtained beyond that level?

The simplest way to test this is to literally expand the cluster one server at a time and test peak capacity with each addition.  However, at some point this may be unfeasible due to lack of test servers. In that case, one strategy might be to focus on individual downstream applications and verify that they can scale to the required level.  For example, a downstream database could be load tested directly to see how many queries per second can be supported.  This will provide a cap on the scalability of the upstream application.  The same thing can be done with a downstream web service.

Any capacity ceilings hit should be studied so that it is understood what is limiting further horizontal scalability, whether it is network bandwidth, capacity of a database, an architectural flaw in the application, etc.

The load balancing mechanism should also be examined carefully to make sure it does not become a bottleneck, particularly if it has not been used previously or if load is to be increased substantially.

Another possibility might be to deploy the application to the cloud and scale out using large numbers of virtual servers.

Monday, October 31, 2011

A Minimal Load Test Plan

What is a minimal load/stress test plan for a new service or application?  A minimal plan covers two scenarios:
  1. Scalability Test
  2. Stability Test
1. Scalability

Vertical scalability is a measure of how effectively an application can handle increasing amounts of load on a single server.   Ideally, the application can handle increasing amounts of load without significant degradation in response time until reaching some server resource limit such as CPU limits or network adaptor bandwidth limits. The results of a scalability test can be presented in a chart such as the following:
The chart shows, for each of 8 tested load levels, the response time and the transaction rate of the application.  In this case each load level is a number of concurrent requests in increments of one.  In other cases other increments may be appropriate (such as increments of 10) and other measures of load may be appropriate (message size, etc.).  Load should be driven high enough that throughput levels off.  Response time will ideally remain flat as load increases, eventually turning a knee or corner and heading upwards as capacity is reached.  In this case, the application scales nearly perfectly up to 5 concurrent requests, then begins to degrade, with peak throughput around 4,500 queries per second.

The scalability chart provides a large amount of information that can be used for capacity planning, production configuration, etc.  It shows what response times are under typical loads.  It shows the throughput capacity of a single server running the application, and it shows the behavior as capacity is exceeded.

As part of a scalability test, metrics showing server resource usage at each load level should be captured, such as CPU usage, network usage, disk usage, and memory usage.  Logs and errors should be captured.  Similar information should be captured on any downstream systems involved in the test if any, such as databases or services.

Part of the test analysis should involve bottleneck analysis, which is analyzing and determining what is limiting the capacity of the application, what is limiting it to 4,500 queries per second.  This could be server resource usage (hitting CPU, network or disk limits), it could be an increase in response time of a downstream database or server as load increases, it could be contention within the application such as thread blocking or error paths hit at high loads, etc.

An appropriate environment for a scalability test would involve two servers, one for the application and one to act as the client driving the load:


Server resource usage on the load generator should be monitored as well to verify that it is not the bottleneck.

This type of vertical scalability test does not guarantee that the application will scale out horizontally for two reasons: (1) there may be downstream systems such as databases that become bottlenecks at higher loads, and (2) load balancing or clustering systems may not scale as expected.  More extended testing beyond a minimal plan would have to cover these factors as well.

For the vertical scalability test, it is important to drive the application up to peak capacity, regardless of what expected load may be.  Usage may be different than expected, spikes in load may occur, business might grow, etc.  Some performance or stability problems only manifest themselves at higher loads, and it is important to identify these even if production load is expected to be much lower.

2. Stability

The second part of the minimal load test plan is the stability test.  To verify stability, a high load should be run against the application for an extended period of time, at a minimum 24 hours and ideally for days or weeks.  A high load can be determined from the results of the scalability test, just below peak capacity, just below the point at which response time takes a turn for the worse.  In the example above, a load of 5 concurrent requests could be used, assuming those are the final results following resolution of performance bottlenecks.

During the run, server resource usage should be captured and monitored, and error logs monitored, as with the scalability test.  Trends should be monitored closely.  Does response time degrade over time?  That indicates a resource leak.  Does CPU usage increase over time?  That indicates a design or implementation error.  Does memory leak?  Do errors begin to occur at some point or occur in some pattern?  Does the application eventually crash?

Beyond the Minimal Plan

Beyond the minimal plan, other tests are required to ensure the application is completely performant and stable.  These will be covered later (http://sub-second.blogspot.com/2011/11/extending-load-test-plan.html) and include:
  1. Performance regression
  2. Horizontal scalability
  3. Fault tolerance