Showing posts with label linux. Show all posts

Friday, August 24, 2012

How To Add a Timestamp to Each Line of Output on Linux

For performance monitoring on linux, you typically would like your shell script metrics and statistics that are logged periodically to include the timestamp with each line output.  That way, the information can later be correlated with other system events such as event log entries or system errors.  There are two basic scenarios.
  1. Your shell script is echoing information to standard output periodically in some loop
  2. You are just calling a program such as vmstat directly that outputs information periodically
Adding a timestamp in the two scenarios can be handled easily as follows:

Monitoring Loop

If your monitoring script includes a loop that is outputting stats periodically, a timestamp can be added to each line by capturing the output of the "date" command and then adding that information to the output line.
The output of the date command can be captured by using forward single quotes, as follows:

savedDate = `date`

Here is an example of a script making use of this technique:

#
# output stats every $1 seconds until stopped
#
if [ "$1" == "" ] ; then
  echo "syntax= .stats.sh <intervalSeconds>"
  exit
fi
time=$1
echo "Time , QueriesPerSechod" > mysql-stats.log

while :
do
    qps=`mysql -u mysql -e "show status" | awk '{if ($1 == "Queries") print $2}'`
    date=`date`
    echo "$date , $qps" >> mysql-stats.log
    sleep $time
done

Here is an example of the output:

Time , QueriesPerSecond
Wed Aug  8 16:11:58 PDT 2012 , 3029
Wed Aug  8 16:12:08 PDT 2012 , 18195 
Wed Aug  8 16:12:18 PDT 2012 , 18903
...

Direct Output

If you are just calling an app or script such as vmstat, iostat, etc., that outputs stats periodically for you, you can achieve the same effect by piping the command through an app that prepends a timestamp to each line.  For example, to prepend timestamps to the output from vmstat, free, and iostat, you would do the following, depending on a script "timestamp.sh" with the timestamp prepend behavior:

# free
free -g -s 10 | ./timestamp.sh > free.log &
# vmstat
vmstat 10 | ./timestamp.sh > vmstat.log &
# iostat
iostat 10 | ./timestamp.sh > iostat.log &

This would give output such as the following:

07/23/12 10:41:44,procs -----------memory---------- ---swap-- -----io---- --system-- -----cpu-----
07/23/12 10:41:44, r  b   swpd   free   buff  cache   si   so    bi    bo   in   cs us sy id wa st
07/23/12 10:41:44, 6  0   2736 3381052 505844 159601296    0    0    62   119    1    1  6  1 93  0  0
07/23/12 10:41:54, 2  0   2736 3358836 505900 159601728    0    0   102    25  640  414  1  0 99  0  0
07/23/12 10:42:04, 7  0   2736 3329736 505948 159601936    0    0     9    32  927 1263  1  0 98  0  0

The timestamp.sh script is as follows:


#!/usr/bin/perl
#while (<>) { print localtime() . ": $_"; }
while (<>) 
{
($sec,$min,$hour,$mday,$mon,$year,$wday,$yday,$isdst) = localtime(time);
$secpad = sprintf( "%02d", $sec );
$minpad = sprintf( "%02d", $min );
$hourpad = sprintf( "%02d", $hour );
$monpad = sprintf( "%02d", $mon );
$mdaypad = sprintf( "%02d", $mday );
$yearpad = sprintf( "%02d", ($year + 1900) % 100 );
$time = "$monpad\/$mdaypad\/$yearpad $hourpad:$minpad:$secpad";
print $time . ",$_" ;
#17/04/112 16:40:14
}



Wednesday, May 23, 2012

Monitoring Linux Server Usage With Sar

A simple way to monitor server resource usage is with sar.  The following simple shell script sar.sh will monitor cpu, memory, network, and disk every 10 seconds and write each to a separate log file which can be easily imported into a spreadsheet for charting.

Script


# Run sar every 10 seconds until stopped
# cpu
sar -u 10  > sar.cpu.log &
# free memory
sar -r 10  > sar.freememory.log &
# disk total
sar -b 10  > sar.disk.log &
# network by device
#    - Note that you need to filter by the adaptor in use.  
#    - Run "sar -n DEV 10" to see which adaptor is being used
sar -n DEV 10 |grep eth1 > sar.network.log &

Output

The cpu log file shows user and system CPU % utilization:

03:07:55 PM     CPU     %user     %nice   %system   %iowait    %steal     %idle
03:08:55 PM     all     73.99      0.00      2.43      0.21      0.00     23.37
03:09:55 PM     all     81.79      0.00      2.67      0.21      0.00     15.34
03:10:55 PM     all     82.29      0.00      2.68      0.17      0.00     14.86

The free memory log file shows how much memory is free and used:

03:07:55 PM kbmemfree kbmemused  %memused kbbuffers  kbcached  kbcommit   %commit
03:08:55 PM 110106128  88246712     44.49    356468  42850352  30363972      7.61
03:09:55 PM 110053452  88299388     44.52    356472  42879192  30371420      7.61
03:10:55 PM 109989584  88363256     44.55    356484  42914152  30372688      7.61

The disk log file shows read and write transfers per second and bytes read and written per second

03:07:55 PM       tps      rtps      wtps   bread/s   bwrtn/s
03:08:55 PM   7889.59      0.00   7889.59      0.00  58582.09
03:09:55 PM   8454.59      0.00   8454.59      0.00  62458.76
03:10:55 PM   8456.30      0.00   8456.30      0.00  62645.15
03:11:55 PM   7257.61      0.00   7257.61      0.00  57384.76

The network log file shows packets received and transmitted per second and bytes received and transmitted per second.

03:00:01 PM     IFACE   rxpck/s   txpck/s    rxkB/s    txkB/s   rxcmp/s   txcmp/s  rxmcst/s
03:08:55 PM      eth1   3285.46   2965.12    956.75   1824.97      0.00      0.00      1.05
03:09:55 PM      eth1   3640.33   3307.06   1053.38   2074.92      0.00      0.00      1.14
03:10:55 PM      eth1   3617.67   3283.23   1047.62   2061.22      0.00      0.00      1.65
03:11:55 PM      eth1   2917.34   2657.74    842.35   1686.10      0.00      0.00      1.38
03:12:55 PM      eth1   3859.74   3502.98   1119.06   2194.43      0.00      0.00      1.15


Wednesday, January 4, 2012

networkspeedtest - a free network bandwidth test application

Download

Network performance problems can cause a variety of difficult to diagnose application performance problems.  It can be necessary to test the bandwidth of the network to verify whether the bandwidth is as expected.
Network speed test is a free, simple network test application that will copy files from one test server to another, showing the network bandwidth used in bytes per second.  This could be compared to a previous baseline to show a network problem.  For example, if 50 MB/sec of bandwidth was previously seen between two test servers, and now there is 1 MB/sec between the same two test servers, there is likely a network problem.

Installation
Unzip networkspeedtest directory to c:\temp


USAGE
copyto <SERVERNAME> repeat

(Copies current directory to SERVERNAME\c$\temp\networkspeedtest showing network speed in bytes per second.)
(repeat parameter causes it to repeat the operation indefinitely)


EXAMPLE
(Shows network bandwidth of 48 MB/sec from current server to SERVER1)

C:\Temp\networkspeedtest> copyto SERVER1 repeat

-- Speed of copying files of varying sizes to SERVER1 in bytes per second
    Speed :            48339531 bps.
    Speed :            58255333 bps.
    Speed :            41308327 bps.
    Speed :            48339531 bps.
    Speed :            48339531 bps.
    Speed :            48339531 bps.
    Speed :            48339531 bps.
    Speed :            48339531 bps.
    Speed :            48339531 bps.
    Speed :            48339531 bps.
    Speed :            41308327 bps.
    Speed :            58255333 bps.
    Speed :            48339531 bps.
    Speed :            41308327 bps.

The following shows windows task manager networking tab during this test:

Monday, November 7, 2011

Monitoring Linux Servers during Performance Tests

The server resource usage of the servers used in a load or performance test should be monitored and saved to be able to later verify system bottlenecks and behavior.  Linux servers can be monitored in a number of different ways.

If you are using Performance Center to drive load, linux monitors can be enabled as part of the load test, allowing the linux metrics to be conveniently combined with other metrics in a single report.  That requires the rstat daemon to be running on the linux servers monitored.  For CentOS, rstat daemon can be installed as follows:

sudo yum install rpcbind
sudo wget http://www.wyzaerd.com/public/rpc.rstatd-4.0.1.tar.gz
sudo tar xvzf rpc.rstatd-4.0.1.tar.gz
cd rpc.rstatd-4.0.1
sudo ./configure
sudo make
sudo make install
sudo /usr/local/sbin/rpc.rstatd

Monitors can then be configured in performance center to collect stats from the linux server running rstatd.

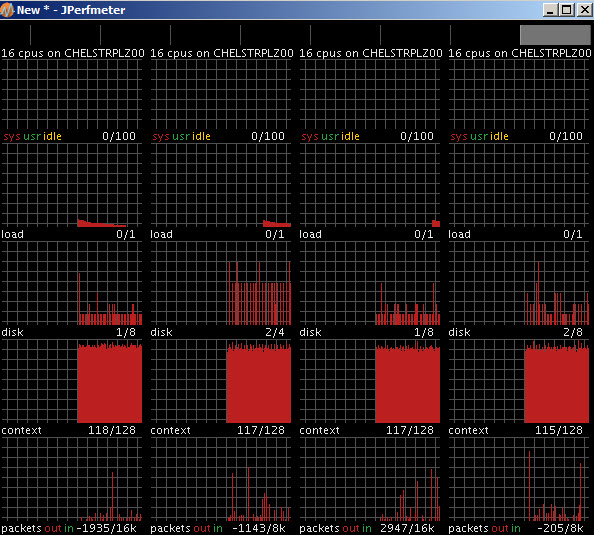
Another tool for viewing and collecting server resource usage on linux is jperfmeter (http://jperfmeter.sourceforge.net/).  Jperfmeter provides a gui view of resource usage metrics of a list of servers, showing values over time.  For example the following shows the jmeter console for a group of 4 linux servers:

The jmeter metrics can be saved to a delimited text file for later analysis:

A third tool for monitoring linux server resource usage is sar. The following script will collect server resource usage on CPU, memory, network, and disk utilization:


# Run sar every 10 seconds until stopped
# cpu
sar -u 10  > sar.cpu.log &
# free memory
sar -r 10  > sar.freememory.log &
# disk total
sar -b 10  > sar.disk.log &
# network by device
#    - Note that you need to filter by the adaptor in use.  
#    - Run "sar -n DEV 10" to see which adaptor is being used
sar -n DEV 10 |grep eth1 > sar.network.log &

On some versions of sar, it is necessary to provide a number of data points to collect such as the following:

# Run sar every 10 seconds until stopped
# cpu
sar -u 10 99999 > sar.cpu.log &
# free memory
sar -r 10 99999 > sar.freememory.log &
# disk total
sar -b 10 99999 > sar.disk.log &
# network by device
#    - Note that you need to filter by the adaptor in use.  
#    - Run "sar -n DEV 10" to see which adaptor is being used
sar -n DEV 10 99999 |grep eth1 > sar.network.log &


For a test of one or two hours, a 10 second collection interval is convenient, providing a couple of hundred data points.  For an overnight test, a 300 second collection interval is usually appropriate.

Output

The cpu log file shows user and system CPU % utilization:

03:07:55 PM     CPU     %user     %nice   %system   %iowait    %steal     %idle
03:08:55 PM     all     73.99      0.00      2.43      0.21      0.00     23.37
03:09:55 PM     all     81.79      0.00      2.67      0.21      0.00     15.34
03:10:55 PM     all     82.29      0.00      2.68      0.17      0.00     14.86

The free memory log file shows how much memory is free and used:

03:07:55 PM kbmemfree kbmemused  %memused kbbuffers  kbcached  kbcommit   %commit
03:08:55 PM 110106128  88246712     44.49    356468  42850352  30363972      7.61
03:09:55 PM 110053452  88299388     44.52    356472  42879192  30371420      7.61
03:10:55 PM 109989584  88363256     44.55    356484  42914152  30372688      7.61

The disk log file shows read and write transfers per second and bytes read and written per second

03:07:55 PM       tps      rtps      wtps   bread/s   bwrtn/s
03:08:55 PM   7889.59      0.00   7889.59      0.00  58582.09
03:09:55 PM   8454.59      0.00   8454.59      0.00  62458.76
03:10:55 PM   8456.30      0.00   8456.30      0.00  62645.15
03:11:55 PM   7257.61      0.00   7257.61      0.00  57384.76

The network log file shows packets received and transmitted per second and bytes received and transmitted per second.

03:00:01 PM     IFACE   rxpck/s   txpck/s    rxkB/s    txkB/s   rxcmp/s   txcmp/s  rxmcst/s
03:08:55 PM      eth1   3285.46   2965.12    956.75   1824.97      0.00      0.00      1.05
03:09:55 PM      eth1   3640.33   3307.06   1053.38   2074.92      0.00      0.00      1.14
03:10:55 PM      eth1   3617.67   3283.23   1047.62   2061.22      0.00      0.00      1.65
03:11:55 PM      eth1   2917.34   2657.74    842.35   1686.10      0.00      0.00      1.38
03:12:55 PM      eth1   3859.74   3502.98   1119.06   2194.43      0.00      0.00      1.15

These can be charted to provide a simple overview of server resource usage as follows: