Tuesday, September 29, 2015

Load Testing with Selenium Grid

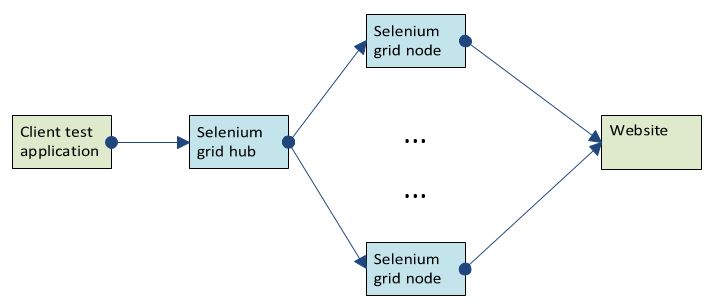
Selenium grid is an open source browser-based test tool that allows multiple concurrent browsers to run at the same time, spread across a number of nodes.  With each node running multiple browsers and many nodes in place, a significant number of concurrent browsers be pointed at a web site and substantial load generated.

Some Advantages

Selenium webdriver runs real browsers which execute javascript on the client-side and can give realistic response times and realistic user behavior.

Selenium integrates well with modern java stacks such as junit, testng, jenkins, gradle, ant, etc.

Cost.


Some Drawbacks

There may be bugs, such as limited compatibility with some versions of some browsers.

There may be maintenance overhead.

The amount of load that can be generated is limited.  Real browsers are expensive to run in terms of cpu and memory requirements, so a lot of client nodes can be required to generate enough load.  It is more appropriate for moderate load.  I'm not sure what the limits of the number of concurrent browsers this approach will support, but dozens of concurrent browsers can easily be supported.  It is possible that hundreds of concurrent browsers may be too much.  For very large tests, commercial tools and more efficient load generation approaches targeting lower-level traffic may be more suitable.


How

Set up a selenium grid hub and a number of selenium grid nodes registered to that hub.  This can be done in a cloud provider such as AWS or using on-premise hardware.
The desired versions of browsers to be tested should be installed on the nodes.
Nodes should have graphics cards that give responsive browser behavior.
Limit the max number of browsers per node to be no more than the number of CPUs per node.
Other than for node debugging, disable node logging which can be very verbose and fill up the file system.
In the java client test application, each test thread should get a thread local instance of Selenium WebDriver.  This will result in a thread-safe WebDriver, with browsers not interfering with one another.
Test the node infrastructure by, for example, running five browsers on one node versus running one browser on each of five nodes.
Once the grid infrastructure has been validated, the target website can then be tested for scalability by slowly ramping up the number of concurrent browsers until response time knee is hit.
Stability of the target website can be tested by running near peak load for an extended period of time.  Be sure to log results along the way in case of a client-side crash.
Browser snapshots can be saved when errors are encountered, making bug identification simple.

Tuesday, December 3, 2013

Performance Testing in a Continuous Integration Environment

Software development groups with continuous integration in place (to handle automatic build and test on any check-in) should ideally include performance and load testing in the continuous integration process.  This article describes my experiences implementing such a solution at a large enterprise software company.

Infrastructure Needed

  • A continuous integration system such as jenkins, teamcity, etc. that is able to build code and run tests
  • An automated deployment system that can programmatically deploy and start newly built code
  • A performance test framework supporting performance tests that are runnable by the continuous integration system against the automatically deployed code

Performance test framework
The performance test framework could be a third-party framework such as jmeter that integrates well with CI systems, unit test frameworks (such as testng or junit) and other open source software.  the solution I chose was to implement an in-house performance test framework.  This perf test framework was designed to make it trivial to take an arbitrary junit test class and convert it to a performance test with less than 5 minutes of work.  This allows the extensive library of automated tests already implemented (in the junit framework) to be leveraged as performance test cases.

This performance test framework supported functionality including the following, which would be a reasonable minimal set of performance test framework functionality:


  • Allow any test case to be converted to a performance test with minimal effort.  (In this case, it is achieved by having the test class extend a PerfTestBase class and implement an IPerfTest interface.)
  • Allow any block of code to be wrapped as a transaction to be measured.
  • Allow the test to be run for a configured amount of time or a configured number of iterations.
  • Allow the test to be run concurrently by a configurable number of client threads.
  • Allow the test to gradually scale up load as configured, such as 1 test case at a time, 2 concurrent test cases, 5 concurrent test cases, etc.
  • Handle exceptions and errors.
  • Allow the test to pass or fail based on configurable performance criteria such as response time SLAs, performance versus previous test runs, etc.
  • Allow the test to be run in an IDE, from the command line, and from the continuous integration system.
  • Persist results in a database for historical reporting
  • Automatically generate test result artifacts and charts including response time trends over time, performance relative to previous test runs, performance versus number of concurrent test cases, etc.
  • Automatically calculate any performance metrics needed for reporting.
  • Automatically push results to sinks such as email distribution lists, dashboards, third party reporting repositories, etc.

Stretch goals for a performance test framework include the following:


  • Handle stress test cases in which the test process, the services under test, or the OS might freeze up, requiring external monitoring and catastrophic failure handling.
  • Handle capacity testing in which the absolute capacity of a service is reached programmatically.
  • Handle performance of fault-tolerance scenarios in which some of the services under test are programmatically brought down and up.


Findings
My experience doing performance testing within the continuous integration system is that the tests find, on a daily basis, deep stability and performance bugs. Bugs found include deadlocks, race conditions, out of memory exceptions, process crashes, response time regressions, etc.  This allows a very large amount of performance testing to be done with minimal staffing resources.  There are up-front costs implementing the tests and getting them running the continuous integration system.  Once the performance tests are implemented, the bulk of the ongoing work involves triaging, driving and resolving the performance and stability bugs that are found automatically on a daily basis.

I believe this type of system constitutes a significant leap forward versus traditional manual performance testing.  Traditional, manual performance testing  is labor intensive and requires expensive, antiquated third-party testing tools.

Tuesday, February 5, 2013

Timing Command Line Applications on Linux


The command line time utility available on linux as /usr/bin/time can be used to measure the elapsed time of test applications launched from the command line, and also measure other information such as cpu time and other metrics, outputting the result as a csv file that can then be easily charted.  Using the "format" option of the time utility allows the output to be formatted as csv with a single line per app run, rather than the default output which contains multiple lines of output.

Script


echo TestCase , Seconds , RealTime , CpuTimeUser , CpuTimeKernel
/usr/bin/time --format="MyTestCase1 , %e , %E , %U , %S" ./mytestcase1.sh mytestcase1parameter

/usr/bin/time --format="MyTestCase2 , %e , %E , %U , %S" java -jar mytestcase2.jar


Output


TestCase , Seconds , RealTime , CpuTimeUser , CpuTimeKernel
MytestCase1 , 679.33 , 11:19.33 , 227.13 , 105.85
MytestCase2 , 460.99 , 7:40.99 , 96.32 , 44.64

Format String


The format string can be configured to output the following options:

       Time
       %E     Elapsed real time (in [hours:]minutes:seconds).
       %e     (Not in tcsh.) Elapsed real time (in seconds).
       %S     Total number of CPU-seconds that the process spent in kernel mode.
       %U     Total number of CPU-seconds that the process spent in user mode.
       %P     Percentage of the CPU that this job got, computed as (%U + %S) / %E.

       Memory
       %M     Maximum resident set size of the process during its lifetime, in Kbytes.
       %t     (Not in tcsh.) Average resident set size of the process, in Kbytes.
       %K     Average total (data+stack+text) memory use of the process, in Kbytes.
       %D     Average size of the processâs unshared data area, in Kbytes.
       %p     (Not in tcsh.) Average size of the processâs unshared stack space, in Kbytes.
       %X     Average size of the processâs shared text space, in Kbytes.
       %Z     (Not in tcsh.) Systemâs page size, in bytes.  This is a per-system constant, but varies between systems.
       %F     Number of major page faults that occurred while the process was running.  These are faults where the page has to be  read  in  from
              disk.
       %R     Number of minor, or recoverable, page faults.  These are faults for pages that are not valid but which have not yet been claimed by
              other virtual pages.  Thus the data in the page is still valid but the system tables must be updated.
       %W     Number of times the process was swapped out of main memory.
       %c     Number of times the process was context-switched involuntarily (because the time slice expired).
       %w     Number of waits: times that the program was context-switched voluntarily, for instance while waiting for an I/O operation  to  com-
              plete.

       I/O
       %I     Number of file system inputs by the process.
       %O     Number of file system outputs by the process.
       %r     Number of socket messages received by the process.
       %s     Number of socket messages sent by the process.
       %k     Number of signals delivered to the process.
       %C     (Not in tcsh.) Name and command-line arguments of the command being timed.
       %x     (Not in tcsh.) Exit status of the command.

Monday, December 10, 2012

Loadrunner How to Download an Image

Usually images such as jpg, gif, png, etc., will be downloaded automatically as extra resources.  However, occasionally it is necessary to download images directly.  Downloading an image directly can be done easily as follows:
  • make web_url call requesting jpg, gif, png, etc.
  • Set Resource=1 indicating the the downloaded item is a resource
  • Use content type/mime type "image/jpg", "image/gif", "image/png", etc.
The following script illustrates this method as follows:
  • Image of type png is downloaded
  • Downloaded image file size is retrieved and checked that it is as expected.
  • Script writes an error message is the downloaded size is not as expected.

Script


Action()
{
long imgSize=0;

web_url("test pdf download",    
"URL=http://www.google.com/images/nav_logo114.png",
"Resource=1",
"RecContentType=image/png",
"Snapshot=t1.inf",
LAST);

    // Save pdf file size
imgSize = web_get_int_property(HTTP_INFO_DOWNLOAD_SIZE);

// Verify size is as expected (~28765 bytes 321 header bytes)
if (imgSize < 28765 ) {
lr_error_message("File download error, expected ~247,800 bytes but got %d", imgSize);
} else {
lr_output_message("File downloaded size okay, expected ~247,800 bytes and got %d", imgSize);
}

return 0;
}

Console Output


Running Vuser...
Starting iteration 1.
Starting action Action.
Action.c(6): web_url("test pdf download") was successful, 28765 body bytes, 321 header bytes   [MsgId: MMSG-26386]
Action.c(14): web_get_int_property was successful   [MsgId: MMSG-26392]
Action.c(20): File downloaded size okay, expected ~247,800 bytes and got 29086
Ending action Action.
Ending iteration 1.
Ending Vuser...

Friday, December 7, 2012

Loadrunner How to Download PDF File

A pdf file can be downloaded in loadrunner as follows:

  • make web_url call requesting pdf
  • Set Resource=1 indicating the the downloaded item is a resource
  • Use content type/mime type "application/pdf"
The following script illustrates this method as follows:
  • Pdf is downloaded
  • Downloaded pdf file size is retrieved and checked that it is as expected.
  • Pdf file contents is saved to a parameter

Script

Action()
{
long pdfSize=0;

web_reg_save_param("pdfContent", 
"LB=", 
"RB=", 
LAST );

web_url("test pdf download",    
"URL=http://research.google.com/archive/disk_failures.pdf",
"Resource=1",
"RecContentType=application/pdf",
"Snapshot=t1.inf",
LAST);

    // Save pdf file size
pdfSize = web_get_int_property(HTTP_INFO_DOWNLOAD_SIZE);

// Verify size is as expected (~247808 bytes)
if (pdfSize < 247000) {
//End the transaction
lr_error_message("File download error, expected ~247,800 bytes but got %d", pdfSize);
} else {
lr_output_message("File downloaded size okay, expected ~247,800 bytes and got %d", pdfSize);
}


lr_output_message("pdfContent=%s", lr_eval_string("{pdfContent}"));

return 0;
}

Console Output

Starting action Action.
Action.c(6): Registering web_reg_save_param was successful   [MsgId: MMSG-26390]
Action.c(11): Redirecting "http://research.google.com/archive/disk_failures.pdf" (redirection depth is 0)   [MsgId: MMSG-26694]
Action.c(11): To location "http://static.googleusercontent.com/external_content/untrusted_dlcp/research.google.com/en/us/archive/disk_failures.pdf"   [MsgId: MMSG-26693]
Action.c(11): web_url("test pdf download") was successful, 247808 body bytes, 715 header bytes   [MsgId: MMSG-26386]
Action.c(19): web_get_int_property was successful   [MsgId: MMSG-26392]
Action.c(26): File downloaded size okay, expected ~247,800 bytes and got 248523
Action.c(30): pdfContent=HTTP/1.0 302 Found
Location: http://static.googleusercontent.com/external_content/untrusted_dlcp/research.google.com/en/us/archive/disk_failures.pdf
Cache-Control: private
Content-Type: text/html; charset=UTF-8

Wednesday, November 21, 2012

Mysql Performance Monitoring - Script


The following provides a linux shell script that provides some basic mysql performance monitoring.  It reports the following metrics every N seconds based on the parameter passed in:
  • timestamp
  • queries per second
  • threads connected
  • connections
  • slow queries per second
  • rows read per second
  • rows inserted per second
  • rows updated per second
  • rows deleted per second
The results are written into a csv output file mysql-stats.csv.

Script


# mysql-stats.sh
# mysql stats sampled every $1 seconds until stopped
#

if [ "$1" == "" ] ; then
  echo "syntax= ./mysql-stats.sh <intervalSeconds>"
  exit
fi

time=$1
origqps=`mysql -u username -p password "show status" | awk '{if ($1 == "Queries") print $2}'`
origconn=`mysql -u username -p password "show status" | awk '{if ($1 == "Threads_connected") print $2}'`
origconnattempt=`mysql -u username -p password "show status" | awk '{if ($1 == "Connections") print $2}'`
origslowqry=`mysql -u username -p password "show status" | awk '{if ($1 == "Slow_queries") print $2}'`
origrowsread=`mysql -u username -p password "show status" | awk '{if ($1 == "Innodb_rows_read") print $2}'`
originserted=`mysql -u username -p password "show status" | awk '{if ($1 == "Innodb_rows_inserted") print $2}'`
origupdated=`mysql -u username -p password "show status" | awk '{if ($1 == "Innodb_rows_updated") print $2}'`
origdeleted=`mysql -u username -p password "show status" | awk '{if ($1 == "Innodb_rows_deleted") print $2}'`

echo "Stats (show status) sampled every $time seconds" > mysql-stats.csv
echo "Time , Queries , Threads_connected , Connections , Slow_queries , Innodb_rows_read , inserted , updated , deleted" >> mysql-stats.csv

x=1
while :
do

sleep $time
lastqps=`mysql -u username -p password "show status" | awk '{if ($1 == "Queries") print $2}'`
lastconn=`mysql -u username -p password "show status" | awk '{if ($1 == "Threads_connected") print $2}'`
lastconnattempt=`mysql -u username -p password "show status" | awk '{if ($1 == "Connections") print $2}'`
lastslowqry=`mysql -u username -p password "show status" | awk '{if ($1 == "Slow_queries") print $2}'`
lastrowsread=`mysql -u username -p password "show status" | awk '{if ($1 == "Innodb_rows_read") print $2}'`
lastinserted=`mysql -u username -p password "show status" | awk '{if ($1 == "Innodb_rows_inserted") print $2}'`
lastupdated=`mysql -u username -p password "show status" | awk '{if ($1 == "Innodb_rows_updated") print $2}'`
lastdeleted=`mysql -u username -p password "show status" | awk '{if ($1 == "Innodb_rows_deleted") print $2}'`

diffqps=`expr $lastqps - $origqps`
#diffconn=`expr $lastconn - $origconn`
diffconnattempt=`expr $lastconnattempt - $origconnattempt`
diffslowqry=`expr $lastslowqry - $origslowqry`
diffrowsread=`expr $lastrowsread - $origrowsread`
diffinserted=`expr $lastinserted - $originserted`
diffupdated=`expr $lastupdated - $origupdated`
diffdeleted=`expr $lastdeleted - $origdeleted`

avgqps=`expr $diffqps / $time`
#avgconn=`expr $diffconn / $time`
avgconnattempt=`expr $diffconnattempt / $time`
avgslowqry=`expr $diffslowqry / $time`
avgrowsread=`expr $diffrowsread / $time`
avginserted=`expr $diffinserted / $time`
avgupdated=`expr $diffupdated / $time`
avgdeleted=`expr $diffdeleted / $time`

#echo "$avgqps"
date=`date`
echo "$date , $avgqps , $lastconn , $avgconnattempt , $avgslowqry , $avgrowsread , $avginserted , $avgupdated , $avgdeleted" >> mysql-stats.csv

origqps=$lastqps
origconn=$lastconn
origconnattempt=$lastconnattempt
origslowqry=$lastslowqry
origrowsread=$lastrowsread
originserted=$lastinserted
origupdated=$lastupdated
origdeleted=$lastdeleted

done


Output


Stats (show status) sampled every 10 seconds
Time , Queries , Threads_connected , Connections , Slow_queries , Innodb_rows_read , inserted , updated , deleted
Tue Sep 18 14:32:37 PDT 2012 , 13 , 5 , 0 , 0 , 45 , 0 , 0 , 0
Tue Sep 18 14:32:47 PDT 2012 , 13 , 5 , 0 , 0 , 45 , 0 , 0 , 0
Tue Sep 18 14:32:57 PDT 2012 , 1374 , 5 , 0 , 0 , 258 , 352 , 0 , 153
Tue Sep 18 14:33:07 PDT 2012 , 4061 , 26 , 2 , 0 , 907 , 976 , 28 , 83
Tue Sep 18 14:33:17 PDT 2012 , 12122 , 26 , 0 , 0 , 374 , 3026 , 0 , 89
Tue Sep 18 14:33:27 PDT 2012 , 9714 , 26 , 0 , 0 , 45 , 2412 , 0 , 0
Tue Sep 18 14:33:37 PDT 2012 , 8694 , 26 , 0 , 0 , 45 , 2162 , 0 , 0
Tue Sep 18 14:33:47 PDT 2012 , 4659 , 26 , 0 , 0 , 45 , 1153 , 0 , 0
Tue Sep 18 14:33:57 PDT 2012 , 4237 , 26 , 0 , 0 , 45 , 1053 , 0 , 0
Tue Sep 18 14:34:07 PDT 2012 , 3668 , 26 , 0 , 0 , 332 , 921 , 0 , 108
Tue Sep 18 14:34:17 PDT 2012 , 3739 , 26 , 0 , 0 , 45 , 928 , 0 , 0
Tue Sep 18 14:34:27 PDT 2012 , 3636 , 26 , 0 , 0 , 45 , 902 , 0 , 0
Tue Sep 18 14:34:38 PDT 2012 , 4526 , 26 , 0 , 0 , 45 , 1125 , 0 , 0
Tue Sep 18 14:34:48 PDT 2012 , 3734 , 26 , 0 , 0 , 45 , 927 , 0 , 0
Tue Sep 18 14:34:58 PDT 2012 , 3678 , 26 , 0 , 0 , 45 , 912 , 0 , 0


Monday, November 19, 2012

Mysql Performance Monitoring - Graphical Tool

One simple method of mysql performance monitoring is using the free tool MysqlMonitorTool.  It allows you to connect to a set of mysql instances and view charts showing some basic performance information including the following:

  • connections
  • inserted rows per second
  • updated rows per second
  • deleted rows per second
  • read rows per second
  • slow queries per second
  • queries per second
The following shows the display:

The tool is fairly easy to use as follows:
  • Download and unzip from http://sourceforge.net/projects/mysqlmt/
  • Create a batch or executable script that points to the tool's jar file:  java -jar MysqlMonitorTool.jar
  • Run the batch script
  • Click server configuration, then click "add new server", then enter your server configuration (servername, host, port, username, password) for one or more mysql instances.
  • Click "add new server group" and create a server group and add the servers you created to the group.
  • Connect and the app will connect to your instances and provide the following tabs:
    • ProcessList
    • charts
    • Status Vars
    • Server Vars
    • Recording (to record chart output)

Loadrunner Check for Substring in Response

The following describes one method for checking a response for a specific substring.  The method is:

  • Use web_reg_find to search the response to the next request for the specified substring, saving the count in a parameter
  • Make the request
  • Check the count parameter for the number of occurrences of the substring

The following script illustrates the method, searching for the substrings "Google" and "Microsoft" in an http request to http://www.google.com, printing out the results.

Script


Action()
{
char *response;

// save response
        web_reg_save_param("responseParam", 
       "LB=", 
       "RB=", 
       LAST ); 

        // check response for substrings "Google" and "Microsoft"
web_reg_find("Text=Microsoft", "SaveCount=microsoft_count", LAST );
web_reg_find("Text=Google", "SaveCount=google_count", LAST );

// send request
web_url("test", 
"URL=http://www.google.com", 
"Resource=1", 
"RecContentType=text/plain", 
"Referer=http://www.google.com/", 
"Snapshot=t12.inf", 
LAST);

// Save respone to string
//response = lr_eval_string(lr_eval_string("{responseParam}"));
//lr_message("response = %s", response);

// check whether substring "Google" was found
if (strcmp(lr_eval_string("{google_count}"), "0") > 0) {
lr_output_message("Found %s occurrences of substring \"Google\" in response", lr_eval_string("{google_count}"));
} else {
lr_output_message("Did not find substring \"Google\" in response");
}

// check whether substring "Microsoft" was found
if (strcmp(lr_eval_string("{microsoft_count}"), "0") > 0) {
lr_output_message("Found %s occurrences of \"Microsoft\" in response", lr_eval_string("{search_count}"));
} else {
lr_output_message("Did not find substring \"Microsoft\" in response");
}

return 0;
}


Console Output


Starting iteration 1.
Starting action Action.
Action.c(7): Registering web_reg_save_param was successful   [MsgId: MMSG-26390]
Action.c(13): Registering web_reg_find was successful   [MsgId: MMSG-26390]
Action.c(14): Registering web_reg_find was successful   [MsgId: MMSG-26390]
Action.c(17): Registered web_reg_find successful for "Text=Microsoft"   [MsgId: MMSG-26362]
Action.c(17): Registered web_reg_find successful for "Text=Google" (count=7)   [MsgId: MMSG-26364]
Action.c(17): web_url("test") was successful, 5034 body bytes, 736 header bytes   [MsgId: MMSG-26386]
Action.c(31): Found 7 occurrences of substring "Google" in response
Action.c(40): Did not find substring "Microsoft" in response
Ending action Action.
Ending iteration 1.

Wednesday, November 7, 2012

Loadrunner Logging Options

There are a number of different functions provided by Loadrunner for logging, including:

  • lr_message
  • lr_output_message
  • lr_error_message
  • lr_log_message
  • lr_debug_message
  • lr_vuser_status_message
This post provides a script illustrating each of these logging methods, and a description of the differences.

lr_message
The limitation of lr_message is that no source file (such as Action.c) or line number is provided.

lr_output_message
lr_output_message includes source file and line number information which is useful for debugging issues.

lr_error_message
lr_error_message flags the message as an error rather than informational.

lr_log_message
lr_log_message can reduce some network traffic during load tests by not sending messages to the load test output window.

lr_debug_message
lr_debug_message can write message conditionally on certain logging settings being enabled

lr_vuser_status_message
lr_vuser_status_message updates the vuser status field during load tests


The following script illustrates the various logging methods.

Script


Action()
{
// setup test message data
int msgLevel;
char *message = "This is a test message.";
        // save string to a parameter
        lr_save_string(message, "messageParam");

// lr_message test
lr_message("---------------------- lr_message --------------------------");
lr_message("--- lr_message does not show the source file and line number");
lr_message("--- lr_message: %s", message);
lr_message("----------------- end lr_message ---------------------");

// lr_output_message test
lr_message("------------------- lr_output_message -----------------------");
lr_message("--- lr_output_message does show the source file and line number");
lr_output_message("--- lr_output_message: %s", message);
lr_message("----------------- end lr_output_message ---------------------");

        // lr_error_message test
lr_message("------------------- lr_error_message -----------------------");
lr_message("--- lr_error_message writes a message with an Error log level");
lr_error_message("--- lr_error_message: %s", message);
lr_message("----------------- end lr_error_message ---------------------");

// lr_log_message test
lr_message("------------------- lr_log_message ------------------------");
lr_message("--- lr_log_message does not send messages to the output window and could therefore reduce network traffic between agent and load generator in some situations");
lr_log_message("--- lr_log_message: %s", message);
lr_message("----------------- end lr_log_message ---------------------");

// lr_debug_message test
lr_message("------------------- lr_debug_message -----------------------");
lr_message("--- lr_debug_message writes a message if the specified log settings are set");
    msgLevel=lr_get_debug_message();
if (msgLevel & LR_MSG_CLASS_BRIEF_LOG  ) {
lr_message("standard log is enabled");
} else if (msgLevel & LR_MSG_CLASS_EXTENDED_LOG  ) {
lr_message("extended log is enabled");
} else if (msgLevel & LR_MSG_CLASS_DISABLE_LOG  ) {
lr_message("log is disabled");


// log message if brief or extended log are enabled
lr_debug_message(LR_MSG_CLASS_BRIEF_LOG | LR_MSG_CLASS_EXTENDED_LOG, "--- lr_debug_message: %s", "This is written if brief or extended log is enabled");

// disable  brief and extended log
        lr_set_debug_message(LR_MSG_CLASS_BRIEF_LOG, LR_SWITCH_OFF); 
        lr_set_debug_message(LR_MSG_CLASS_EXTENDED_LOG, LR_SWITCH_OFF);

// now the debug message should not be written
lr_debug_message(LR_MSG_CLASS_BRIEF_LOG | LR_MSG_CLASS_EXTENDED_LOG, "This should not be written to log because brief and extended log are both disabled");

// re-enable extended log
        lr_set_debug_message(LR_MSG_CLASS_EXTENDED_LOG, LR_SWITCH_ON);

lr_message("----------------- end lr_debug_message ---------------------");

// lr_vuser_status_message
// lr_log_message test
lr_message("------------------- lr_vuser_status_message ------------------------");
lr_message("--- lr_vuser_status_message updates the status field of the vuser status area.  It does not write to the log");
lr_vuser_status_message("--- lr_vuser_status_message: %s", message);
lr_message("----------------- end lr_vuser_status_message ---------------------");

return 0;
}


Output

Running Vuser...
Starting iteration 1.
Starting action Action.
---------------------- lr_message --------------------------
--- lr_message does not show the source file and line number
--- lr_message: This is a test message.
----------------- end lr_message ---------------------
------------------- lr_output_message -----------------------
--- lr_output_message does show the source file and line number
Action.c(19): --- lr_output_message: This is a test message.
----------------- end lr_output_message ---------------------
------------------- lr_error_message -----------------------
--- lr_error_message writes a message with an Error log level
Action.c(25): Error: --- lr_error_message: This is a test message.
----------------- end lr_error_message ---------------------
------------------- lr_log_message ------------------------
--- lr_log_message does not send messages to the output window and could therefore reduce network traffic between agent and load generator in some situations
--- lr_log_message: This is a test message.
----------------- end lr_log_message ---------------------
------------------- lr_debug_message -----------------------
--- lr_debug_message writes a message if the specified log settings are set
extended log is enabled
--- lr_debug_message: This is written if brief or extended log is enabled
----------------- end lr_debug_message ---------------------
------------------- lr_vuser_status_message ------------------------
--- lr_vuser_status_message updates the status field of the vuser status area.  It does not write to the log
----------------- end lr_vuser_status_message ---------------------
Ending action Action.
Ending iteration 1.
Ending Vuser...
Starting action vuser_end.
Ending action vuser_end.
Vuser Terminated.
Thursday, November 1, 2012

Loadrunner Asynchronous Results Polling Using 11.5 Web Async


Some user action trigger asynchronous server-side operations.  The user can then be forced to check for results periodically by polling the server.  Loadrunner 11.5 provides asynchronous logic allowing callback functions to be specified which are called when the async call finally returns.  The following example gives one example of using the asynchronous callbacks as follows:

  • Include web_api.h to load some needed symbols
  • To capture the time it takes for the async response to come back, specify a global variable showing done state
  • Before the async call, set async polling properties using web_reg_async_attributes such as how often to poll, which callback functions to use, etc.
  • Define the callback functions to be called when the async response is returned and update the done state variable in the callback
  • Make the async call
  • To get the response time, wait until the callback has updated the global state variable
  • End the transaction
  • Stop the async polling

The following shows an example of a script doing this, and the next section shows the script's vugen console output.

Script

// Specify include files
#ifndef _GLOBALS_H
#define _GLOBALS_H

#include "web_api.h"
#endif // _GLOBALS_H
// End include files

// Define a global variable holding done state
int done;

Action()
{
    web_url("wiki",
        "URL=http://ajaxify.com/run/wiki",
        "Resource=0",
        "RecContentType=text/html",
        "Referer=",
        "Snapshot=t37.inf",
        "Mode=HTML",
        LAST);

    // Initialize the global done state variable, and start the async transaction variable
    done = 0;
    lr_start_transaction("async-call");

   // Define the request to be handled asynchronously, in this case a "?messages" call
   // Specify the polling interval of 5 seconds
   // Specify the callback functions that will be called when the response is returned.
   // The callback functions are defined below.     web_reg_async_attributes("ID=Poll_0",
        "URL=http://ajaxify.com/run/wiki/content.php?messages",
        "Pattern=Poll",
        "PollIntervalMs=5000",
        "RequestCB=Poll_0_RequestCB",
        "ResponseBodyBufferCB=Poll_0_ResponseBodyBufferCB",
        "ResponseCB=Poll_0_ResponseCB",
        LAST);

    // now make the async call.
    // note that the script will not block on this call.  processing will continue on past this step while the request is handles asynchronously
    web_url("content.php",
        "URL=http://ajaxify.com/run/wiki/content.php?messages",
        "Resource=0",
        "RecContentType=text/xml",
        "Referer=http://{host_ajaxify_com}/run/wiki/",
        "Snapshot=t38.inf",
        "Mode=HTML",
        LAST);


    // To capture the response time of the async call, wait until the callback is called.
    // Without this, the script would move past and complete the iteration before the callback is called.     while (done==0)
    {
        lr_think_time(1);
    }

    // once the callback has been called, end the transaction to get the response time.
     lr_end_transaction("async-call"LR_AUTO);
     
   // stop the polling
   web_stop_async("ID=Poll_0",
        LAST);

    return 0;
}


/*
*    Callback Implementation
*
*
*/

int Poll_0_RequestCB()
{
    //enter your implementation for RequestCB() here

    return WEB_ASYNC_CB_RC_OK;
}

int Poll_0_ResponseBodyBufferCB(
    const char *    aLastBufferStr,
    int                aLastBufferLen,
    const char *    aAccumulatedStr,
    int                aHttpStatusCode)
{
    //enter your implementation for ResponseBodyBufferCB() here

    // when the response is received, update the global variable
    done = 1;
    // print out the response body and length
    lr_message("in Poll_0_ResponseBodyBufferCB response body callback");
    lr_message("in Poll_0_ResponseBodyBufferCB response body callback, lastBufferLen=%d", aLastBufferLen);
 
    return WEB_ASYNC_CB_RC_OK;
}

int Poll_0_ResponseCB(
    const char *    aResponseHeadersStr,
    int                aResponseHeadersLen,
    const char *    aResponseBodyStr,
    int                aResponseBodyLen,
    int                aHttpStatusCode)
{
    //enter your implementation for ResponseCB() here
 
    lr_message("in Poll_0_ResponseCB response callback, headerLen=%d, bodyLen=%d", aResponseHeadersLen, aResponseBodyLen);
    lr_message("in Poll_0_ResponseCB response callback, header=%s", aResponseHeadersStr);
    lr_message("in Poll_0_ResponseCB response callback, body=%s", aResponseBodyStr);
 
    return WEB_ASYNC_CB_RC_OK;
}


Console Output

Running Vuser...
Starting iteration 1.
Notify: max connections per server : 6
Starting action Action.
Action.c(16): web_url("wiki") started      [MsgId: MMSG-26355]
Action.c(16): Redirecting "http://ajaxify.com/run/wiki" (redirection depth is 0)       [MsgId: MMSG-26694]
Action.c(16): To location "http://ajaxify.com/run/wiki/"  [MsgId: MMSG-26693]
Action.c(16): Found resource "http://ajaxify.com/run/Lib/css/demo.css" in HTML "http://ajaxify.com/run/wiki/"       [MsgId: MMSG-26659]
Action.c(16): Found resource "http://ajaxify.com/run/wiki/wiki.css" in HTML "http://ajaxify.com/run/wiki/"       [MsgId: MMSG-26659]
Action.c(16): Found resource "http://ajaxify.com/run/Lib/js/util.js" in HTML "http://ajaxify.com/run/wiki/"       [MsgId: MMSG-26659]
Action.c(16): Found resource "http://ajaxify.com/run/Lib/js/ajaxCaller.js" in HTML "http://ajaxify.com/run/wiki/"       [MsgId: MMSG-26659]
Action.c(16): Found resource "http://ajaxify.com/run/wiki/wiki.js" in HTML "http://ajaxify.com/run/wiki/"       [MsgId: MMSG-26659]
Action.c(16): Found resource "http://ajaxify.com/favicon.ico" in HTML "http://ajaxify.com/run/wiki/"       [MsgId: MMSG-26659]
Action.c(16): Found resource "http://ajaxify.com/run/Lib/php/button.php" in HTML "http://ajaxify.com/run/wiki/"       [MsgId: MMSG-26659]
Action.c(16): web_url("wiki") was successful, 22491 body bytes, 2152 header bytes, 24 chunking overhead bytes      [MsgId: MMSG-26385]
Action.c(26): Notify: Transaction "polling" started.
Action.c(41): web_reg_async_attributes started       [MsgId: MMSG-26355]
Action.c(41): web_reg_async_attributes was successful      [MsgId: MMSG-26392]
Action.c(50): web_url("content.php") started    [MsgId: MMSG-26355]
Action.c(50): "ID=poll_0" && "Pattern=Poll" && "PollIntervalMs=5000" now applied to URL="http://ajaxify.com/run/wiki/content.php?messages" (RelFrameId=1, Internal ID=10)     [MsgId: MMSG-35172]
Action.c(50): Retaining cross-step download of URL="http://ajaxify.com/run/wiki/content.php?messages" (RelFrameId=1, Internal ID=10)     [MsgId: MMSG-27658]
Action.c(50): web_url("content.php") was successful, 0 body bytes, 0 header bytes       [MsgId: MMSG-26386]
Action.c(62): lr_think_time: 1.00 seconds.
in Poll_0_ResponseBodyBufferCB response body callback
in Poll_0_ResponseBodyBufferCB response body callback, lastBufferLen=928
in Poll_0_ResponseBodyBufferCB response body callback
in Poll_0_ResponseBodyBufferCB response body callback, lastBufferLen=0
in Poll_0_ResponseCB response callback, headerLen=319, bodyLen=928
in Poll_0_ResponseCB response callback, header=HTTP/1.1 200 OK
Server: nginx/0.8.53
Date: Thu, 01 Nov 2012 21:18:42 GMT
Content-Type: text/xml
Transfer-Encoding: chunked
Connection: keep-alive
X-Powered-By: PHP/5.3.5-1ubuntu7.11
Expires: 0
Last-Modified: Thu, 01 Nov 2012 21:18:42 GMT
cache-control: no-store, no-cache, must-revalidate
Pragma: no-cache


in Poll_0_ResponseCB response callback, body=<messages>  <message>
      <id>10</id>
      <lastAuthor>lastAuthor</lastAuthor>
      <ranking>100</ranking>
      <content>Wonder%20Wonder%20ffff%0AStuff%20here%20for%20123fdsfd%0Atest%0Avbnvytytry%0Aokadfasdf%0Artyry%0Artyryry%0Arytry%0Adfgvdfg%0A%0Asdfsad%0A%0Asdfsd%0A%0Aghghhgggh%0A%0Atesteste%0A%0AZe%20woiauha%0A%20df%0A%0Axcvx%0AHello%20friends%21%0Ahello%20folks%0Ahi%0Ajiadsasd%0A%0A%0Azzz</content>
  </message>  <message>
      <id>2</id>
      <lastAuthor>lastAuthor</lastAuthor>
      <ranking>200</ranking>
      <content>ABC%0Aklljljl%0Ak%3Bk%3B%3Bk%3B%0Aggugj%0A%0Affff%0A%0Aasdf%0A%0Abla%0Aqwe%0Aqweqwe%0Ajnknknkjkvfgh%0A</content>
  </message>  <message>
      <id>3</id>
      <lastAuthor>lastAuthor</lastAuthor>
      <ranking>300</ranking>
      <content>This%20is%20line%201%0AThis%20is%20line%202.%0AEnd%0A.%0Adffdfg123123123%0Aawgaw%0Afsdf%0Atestes%0Aasdfadf%0Aadsasd</content>
  </message></messages>
Action.c(62): Issuing a "POLL" request for conversation with ID="poll_0" and "PollIntervalMs=5000". Scheduling due at t=13494, URL="http://ajaxify.com/run/wiki/content.php?messages"     [MsgId: MMSG-35169]
Action.c(62): "ID=poll_0" && "Pattern=Poll" && "PollIntervalMs=5000" now applied to URL="http://ajaxify.com/run/wiki/content.php?messages" (RelFrameId=, Internal ID=11)     [MsgId: MMSG-35172]
Action.c(67): Notify: Transaction "polling" ended with "Pass" status (Duration: 4.0431 Think Time: 1.8491 Wasted Time: 0.0121).
Action.c(69): web_stop_async started       [MsgId: MMSG-26355]
Action.c(69): Notify: Deleting Conversation Information with ID="poll_0"
Action.c(69): Aborting download of URL "http://ajaxify.com/run/wiki/content.php?messages" (RelFrameId=, Internal ID=11) of conversation with ID="poll_0"  [MsgId: MMSG-35167]
in Poll_0_ResponseBodyBufferCB response body callback
in Poll_0_ResponseBodyBufferCB response body callback, lastBufferLen=0
in Poll_0_ResponseCB response callback, headerLen=0, bodyLen=0
in Poll_0_ResponseCB response callback, header=
in Poll_0_ResponseCB response callback, body=
Action.c(69): web_stop_async was successful     [MsgId: MMSG-26392]
Ending action Action.
Ending iteration 1.
Ending Vuser...
Starting action vuser_end.
Ending action vuser_end.
Vuser Terminated.